d3.js, React, Next.js
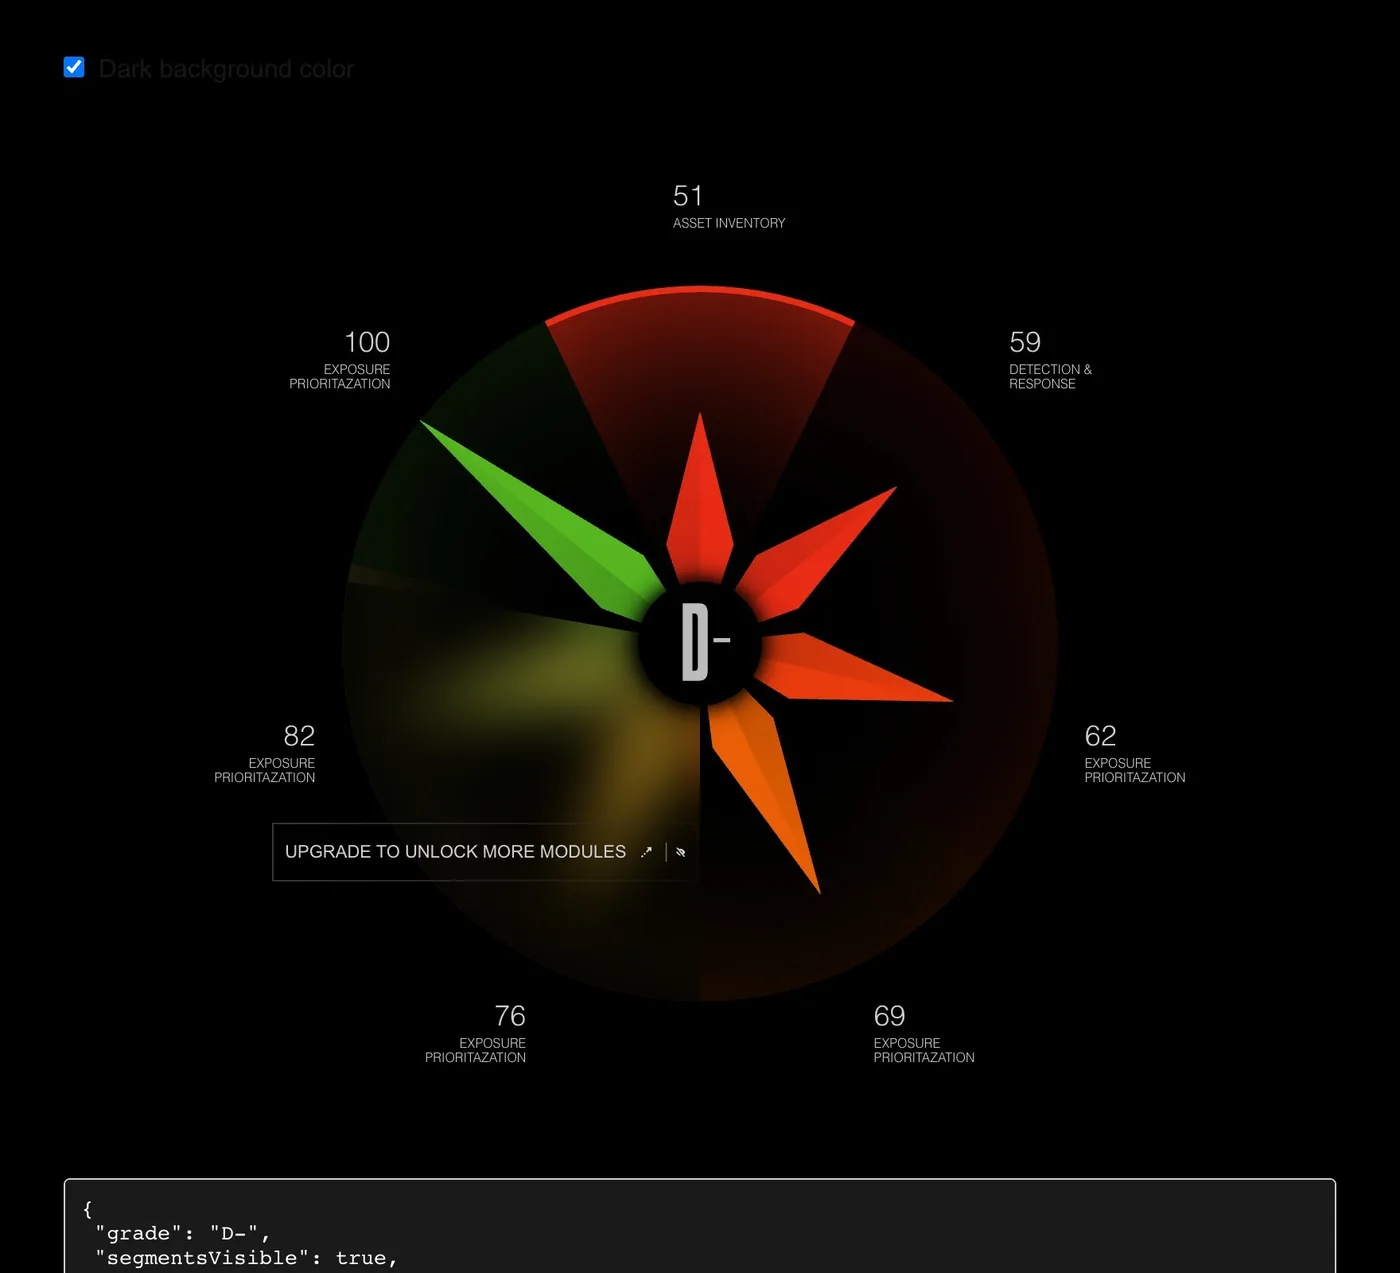
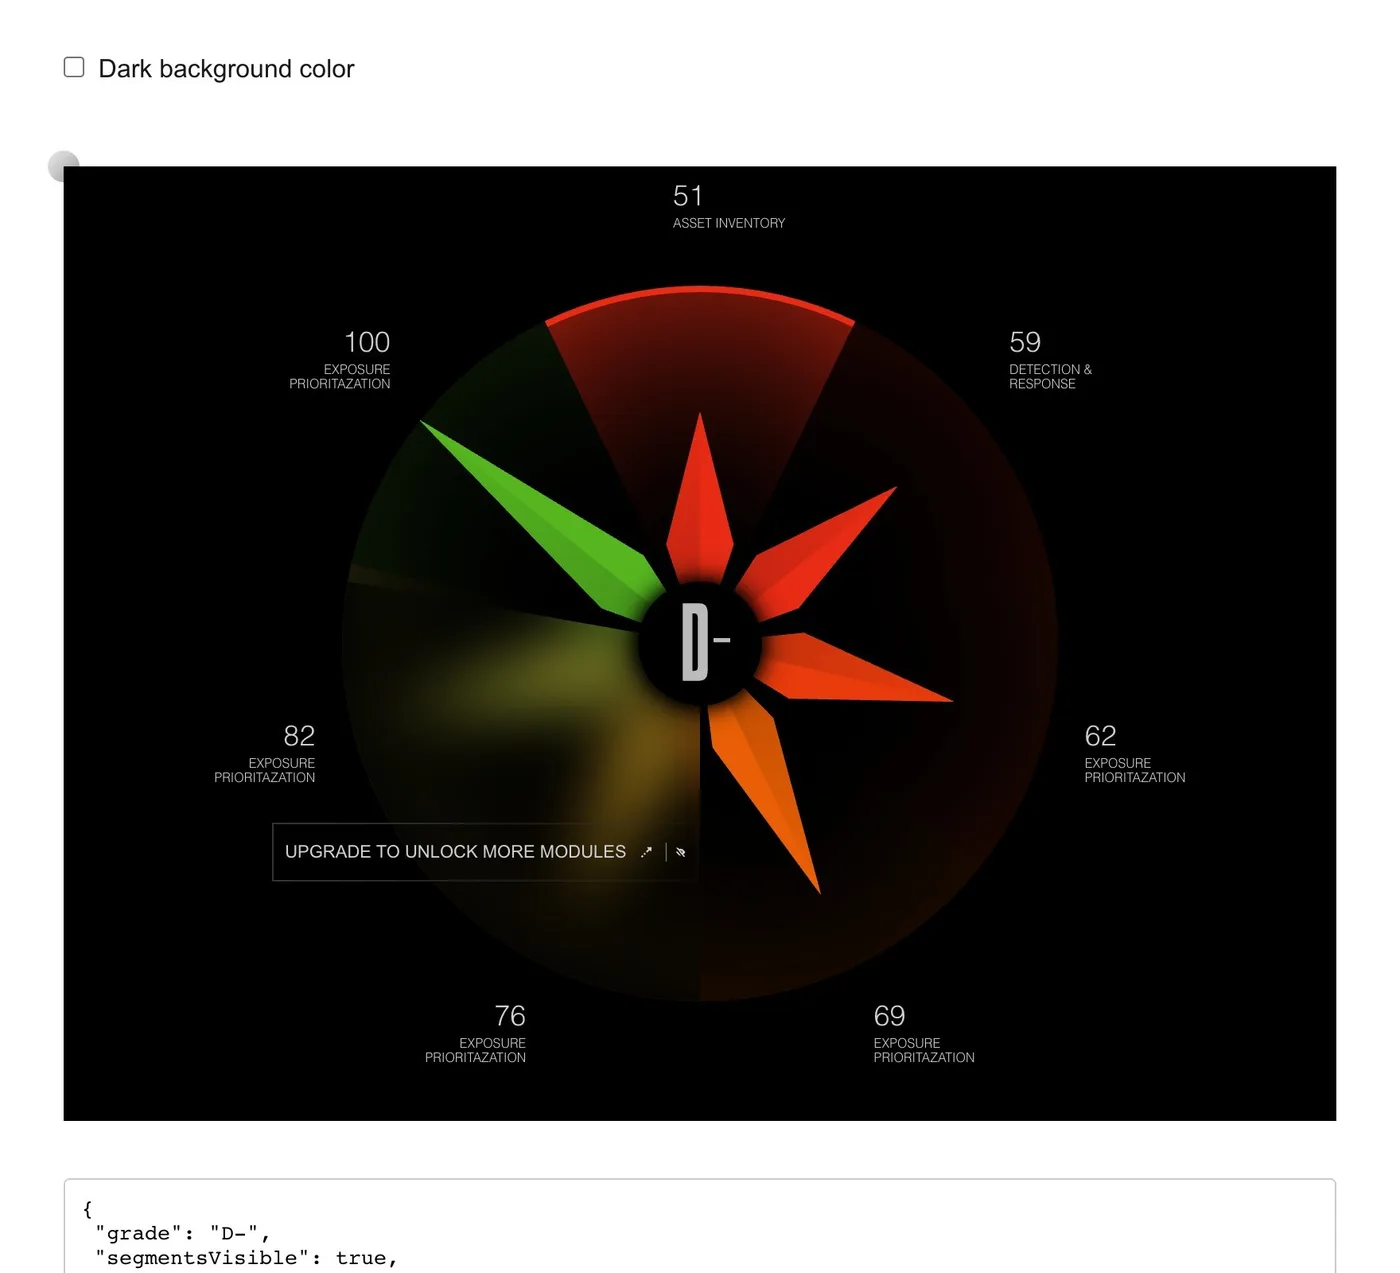
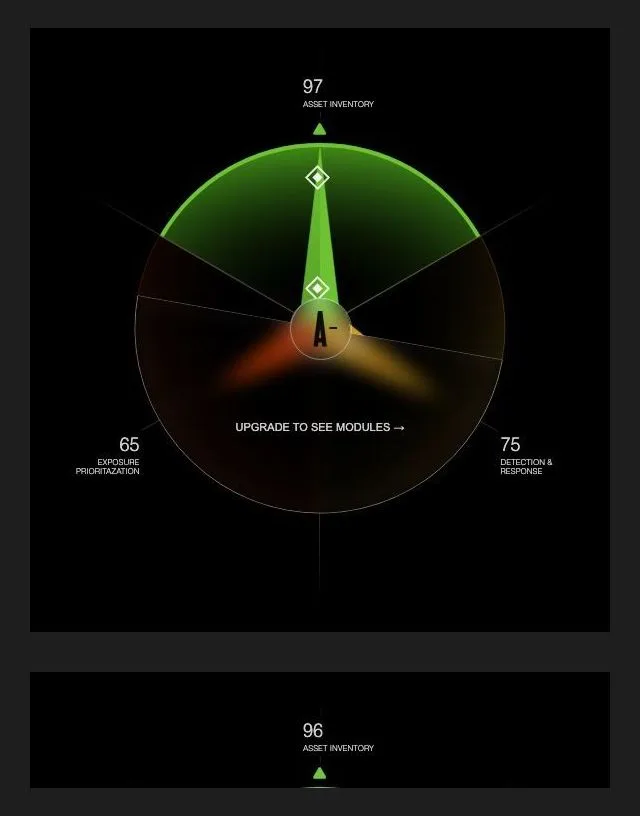
A compass-rose chart where each needle is the score of one security module. I built it in plain d3.js first and then as a React component for a Next.js app.