Number columns get a histogram in the header, and clicking a bar filters the rows without the file leaving the browser.
A Friday experiment at infogr8.
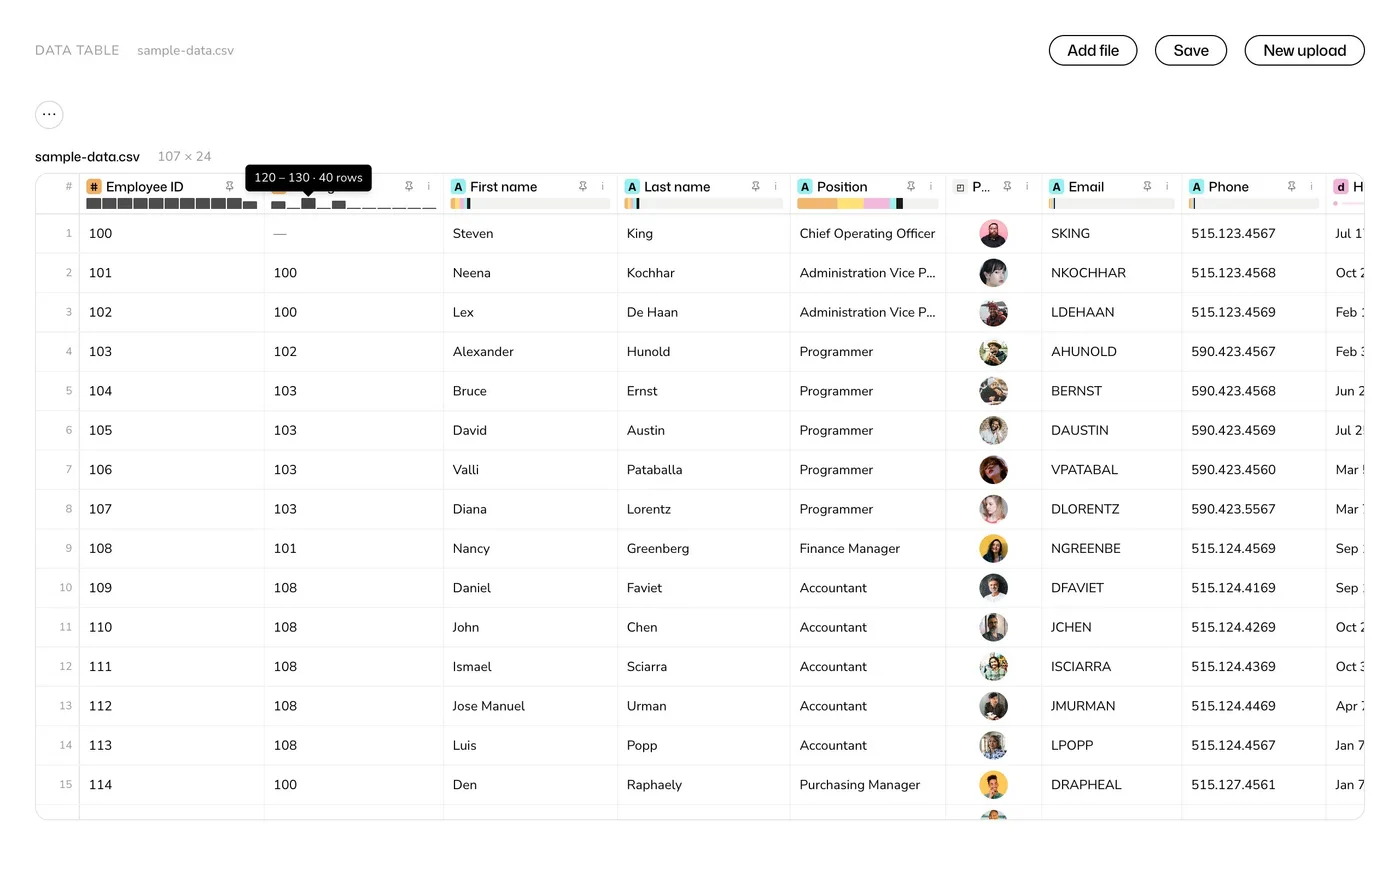
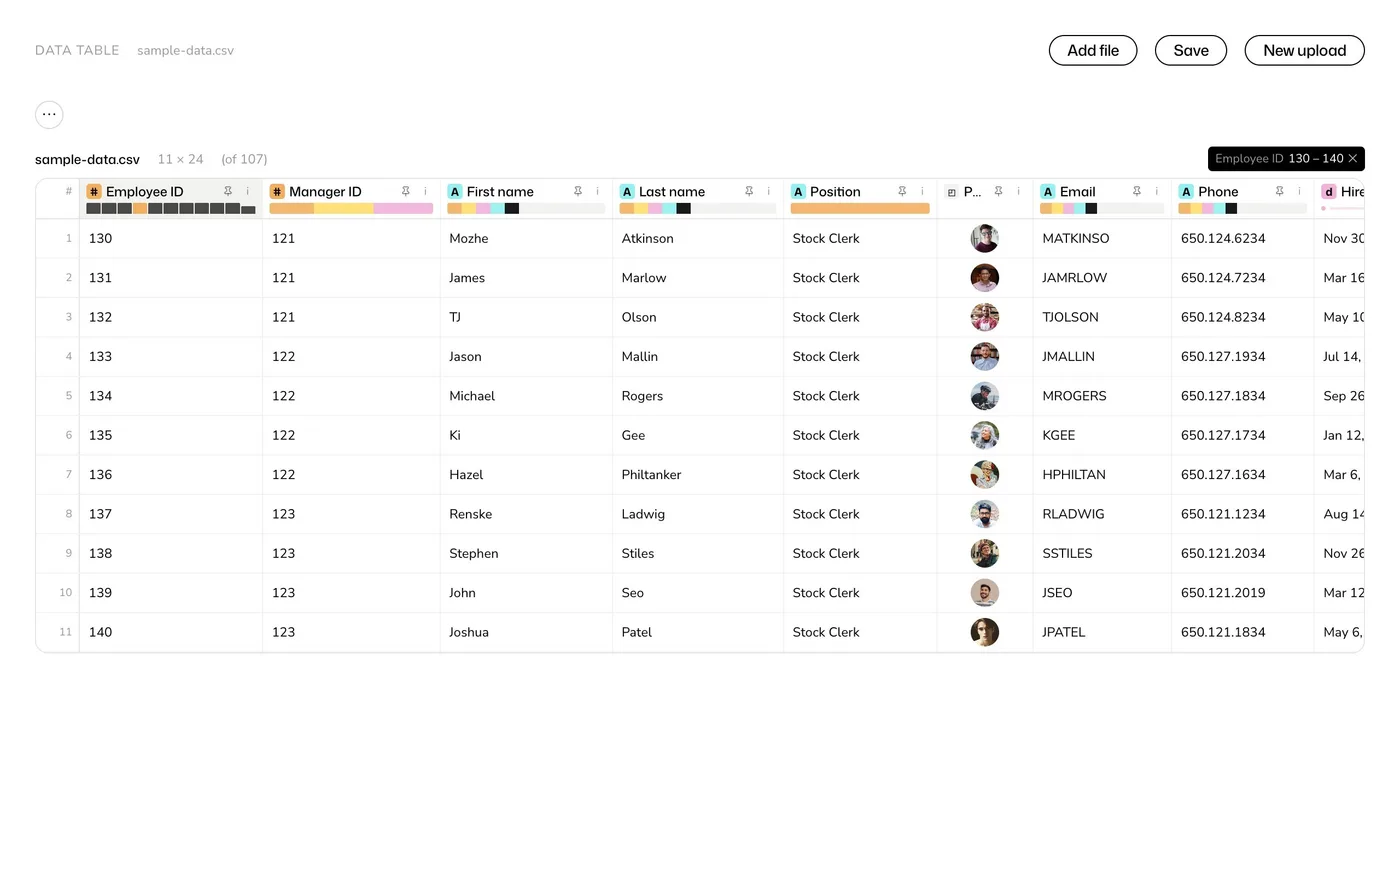
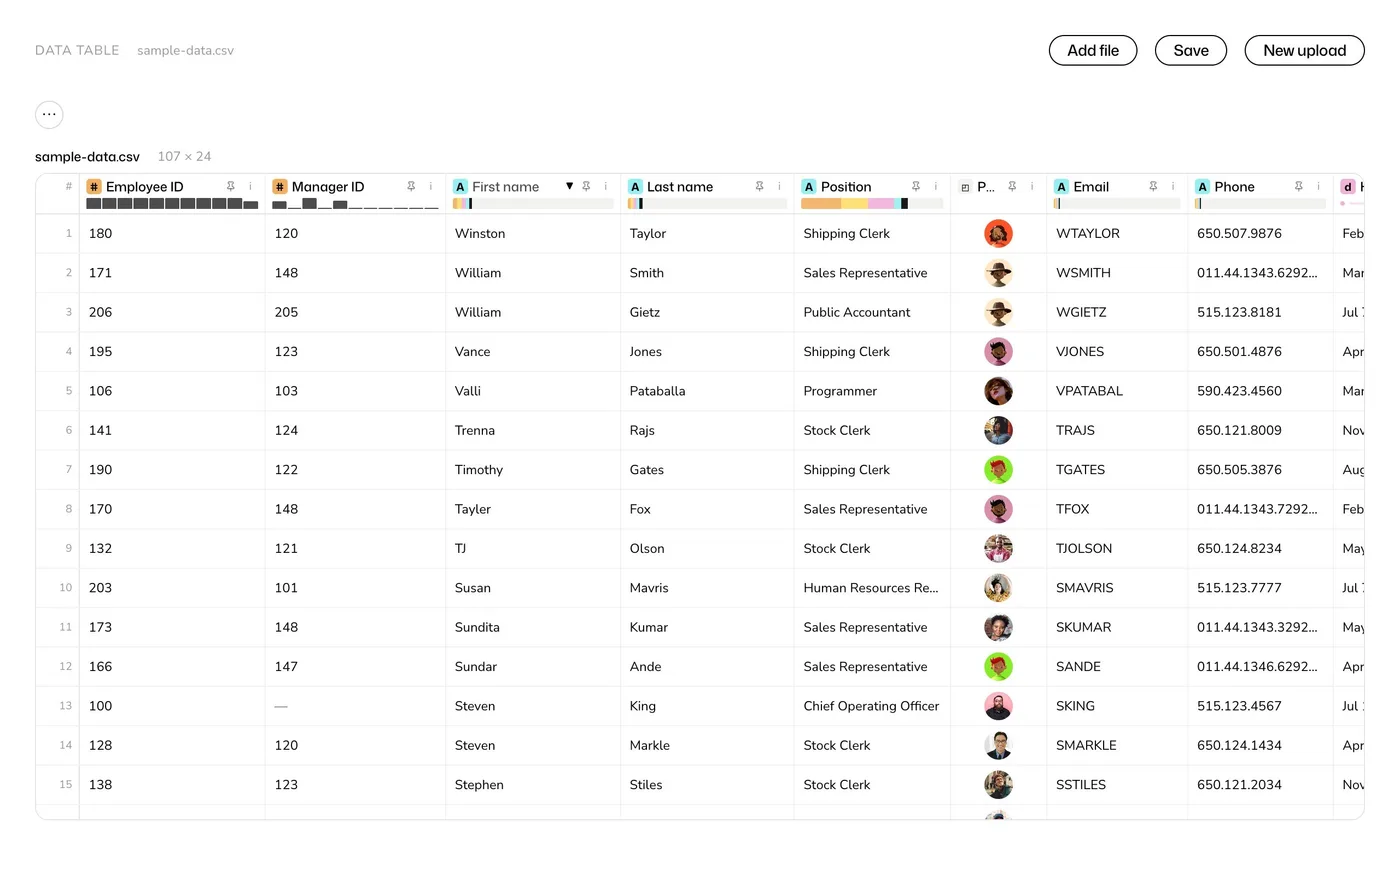
Number columns get a histogram in the header, and clicking a bar filters the rows without the file leaving the browser.
A Friday experiment at infogr8.