d3.js
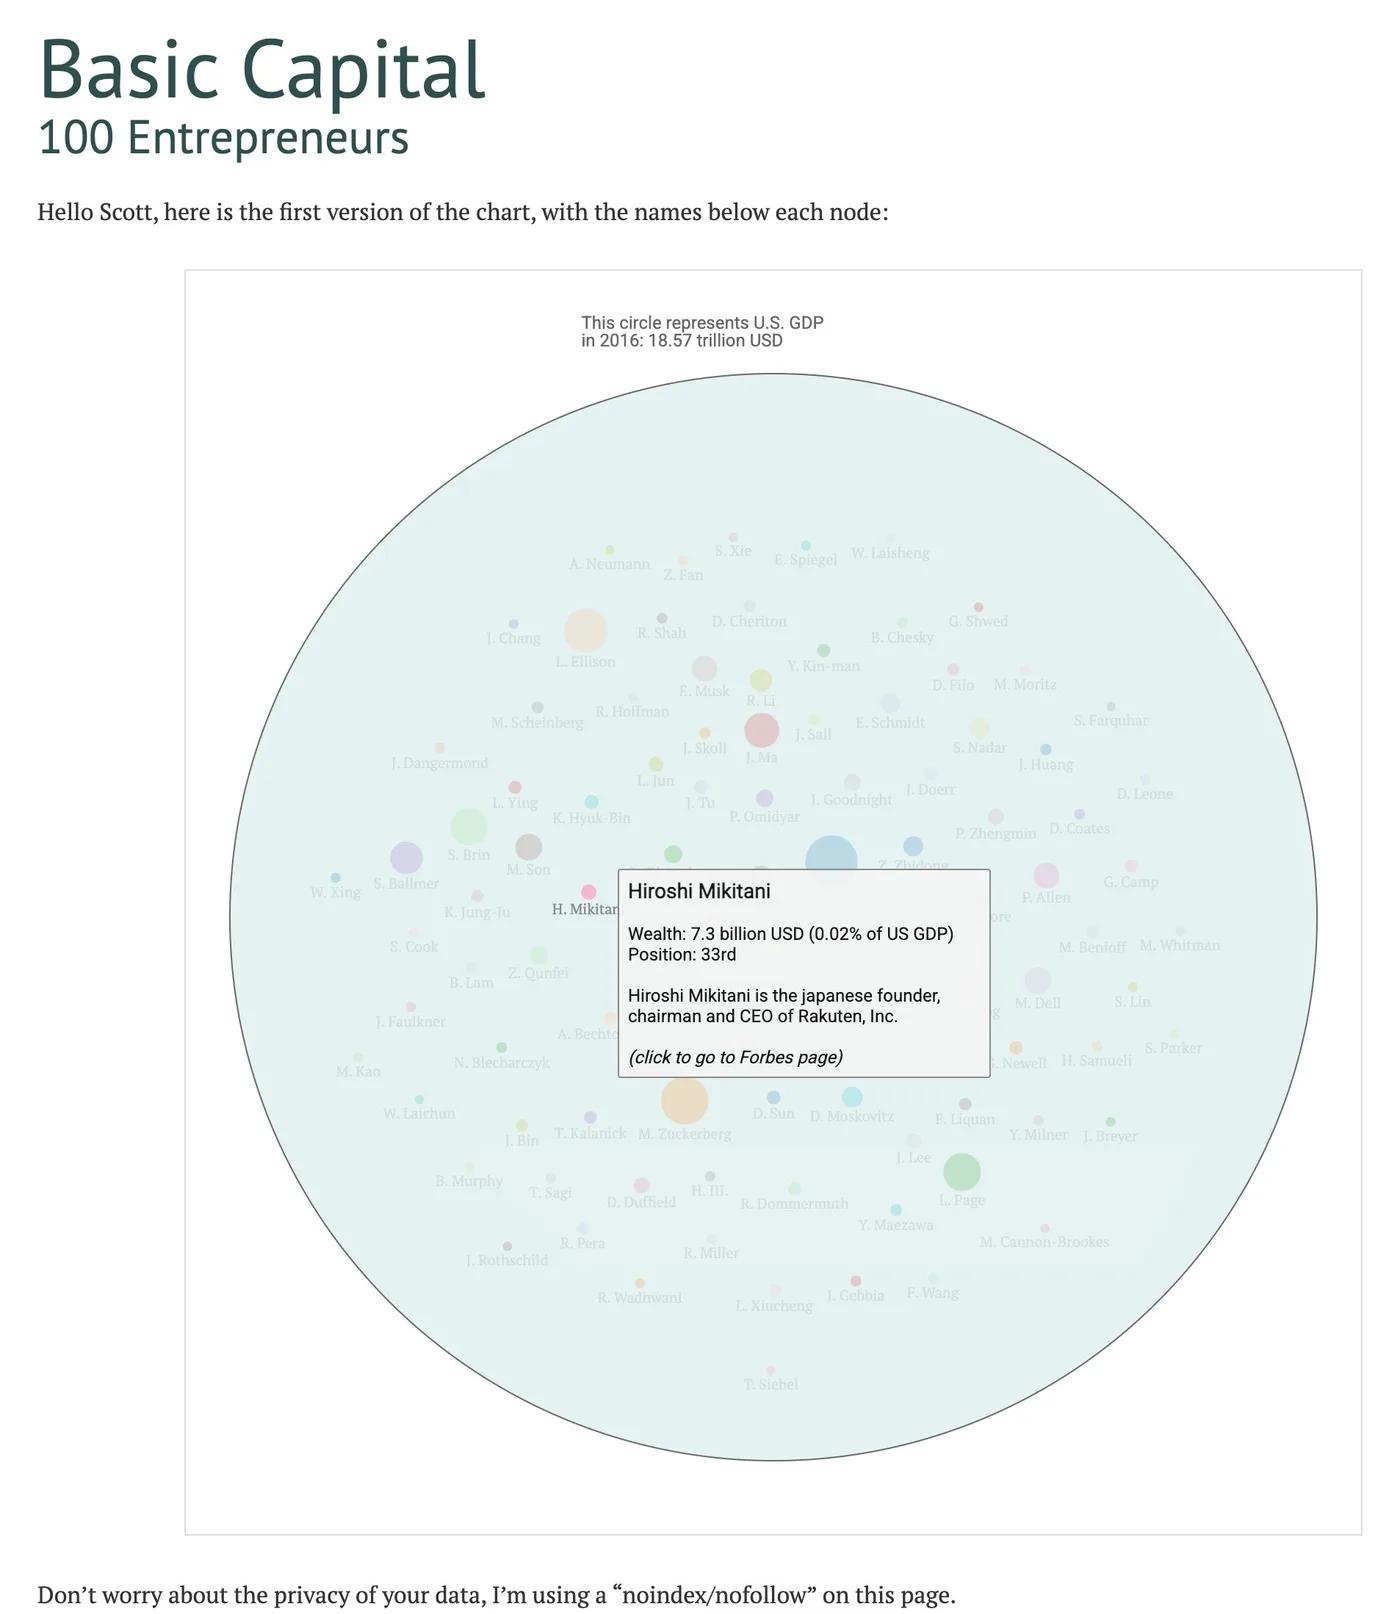
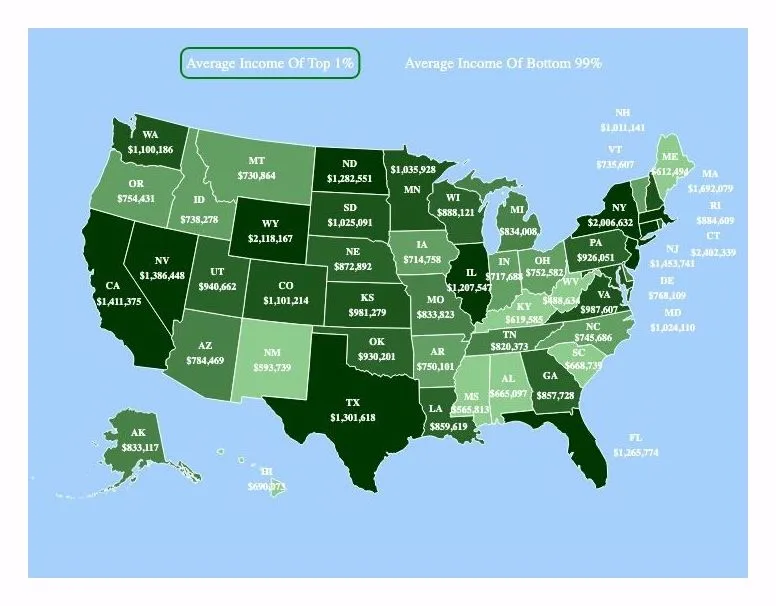
A bubble chart of 100 entrepreneurs inside a circle the size of US GDP. The same project has a US map of income by state.