d3.js, jQuery, Bootstrap
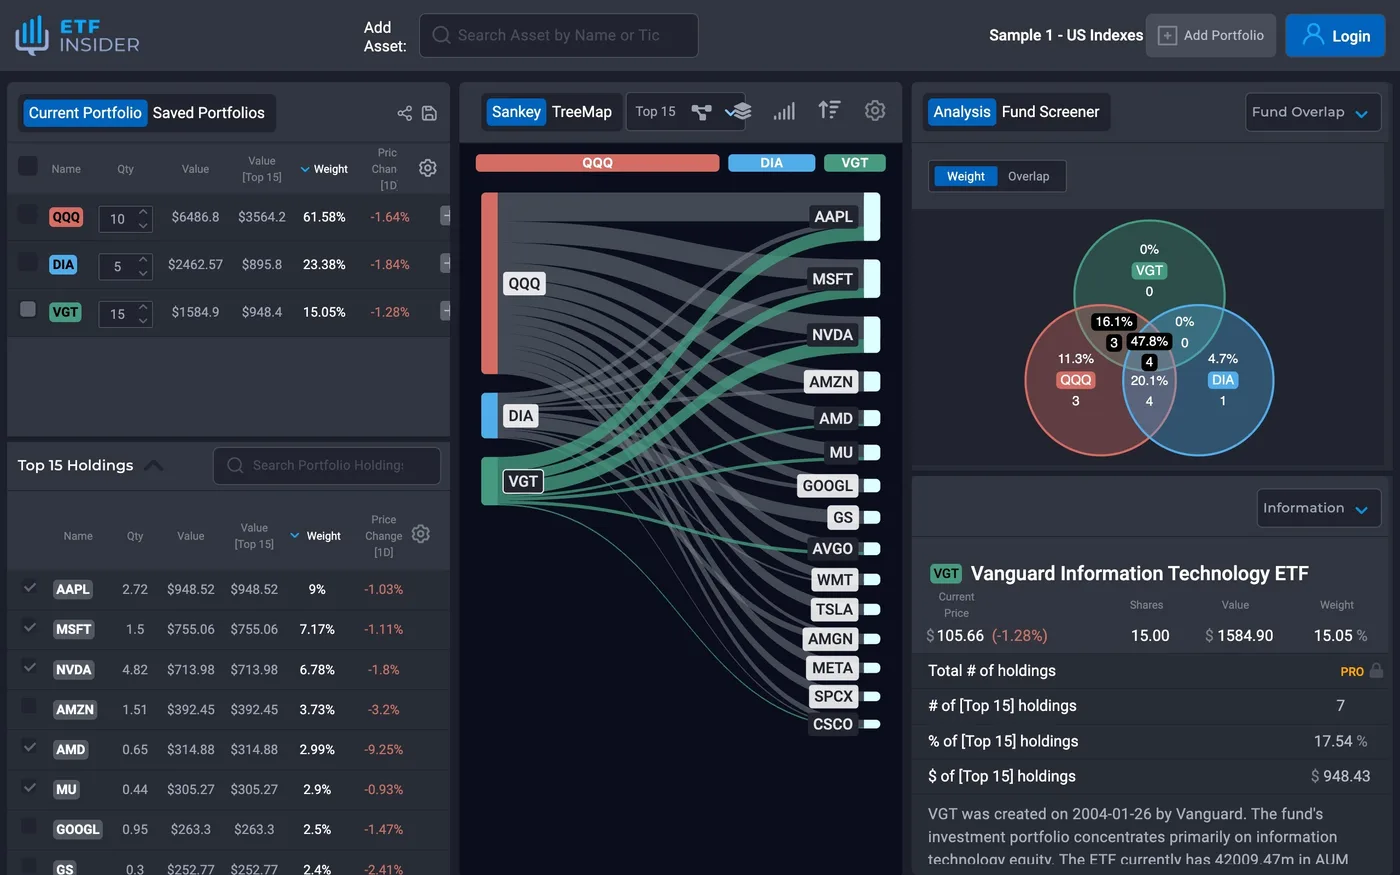
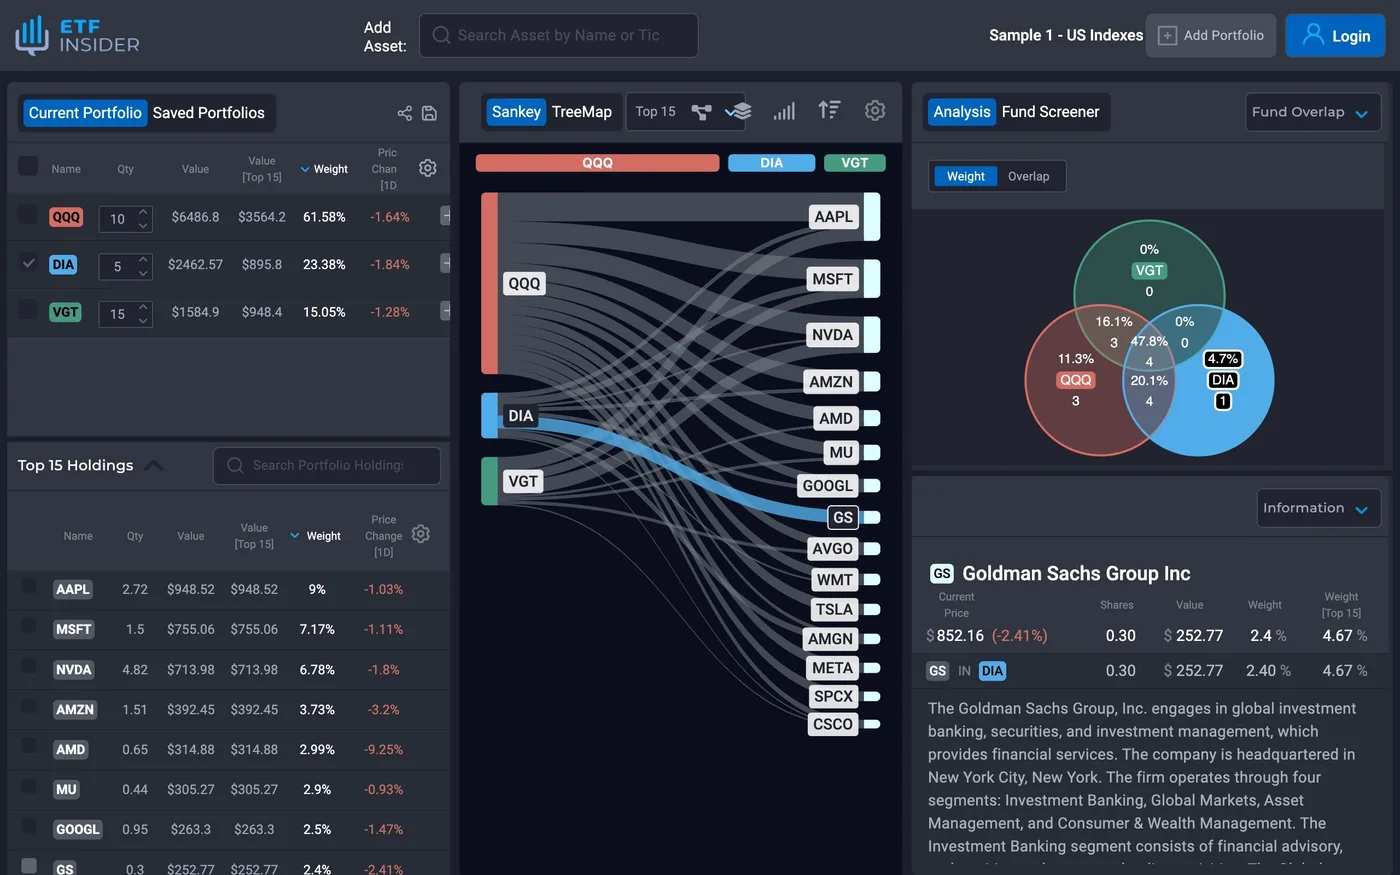
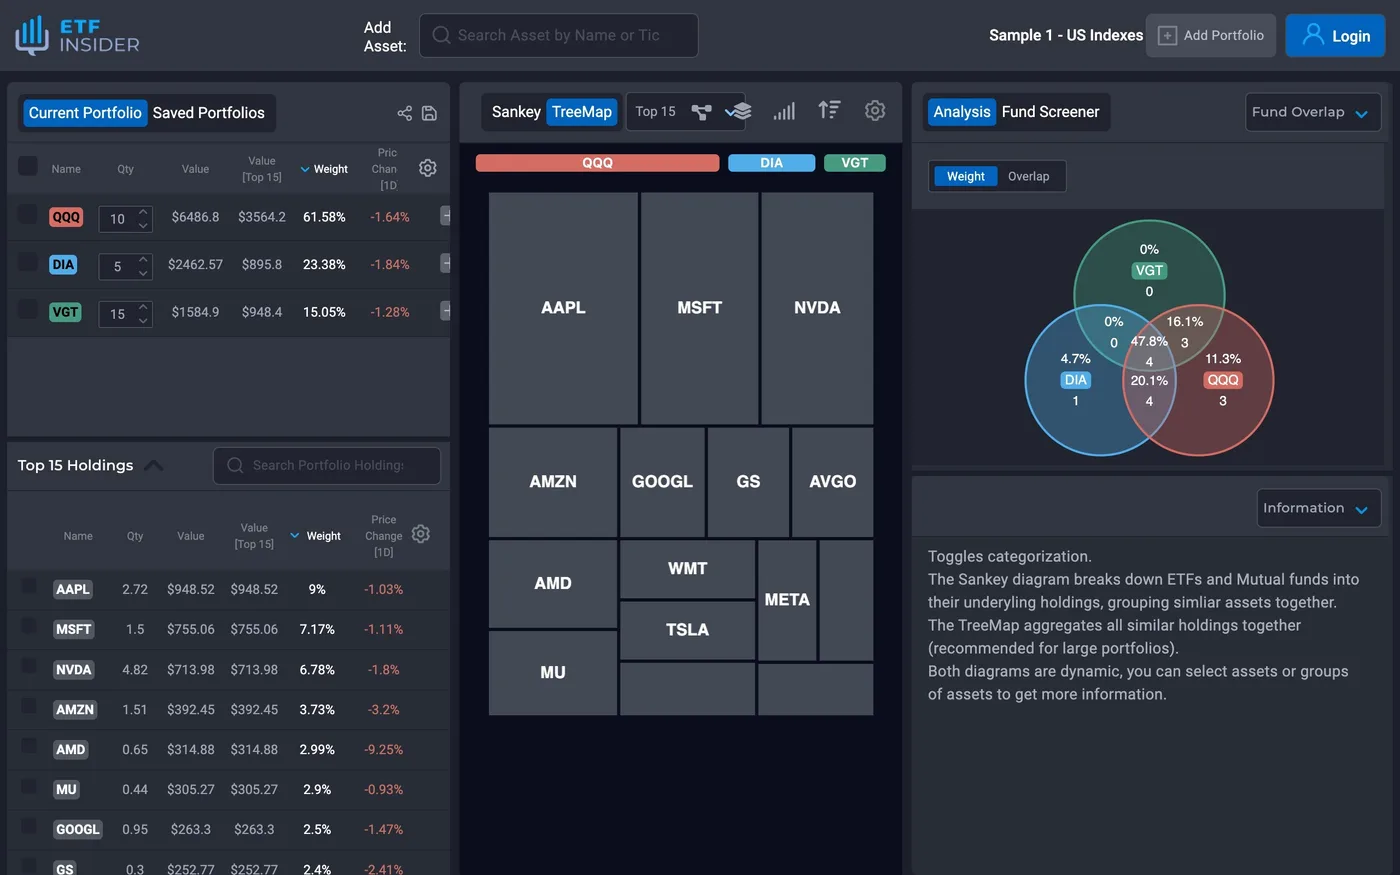
An app that breaks a portfolio of ETFs down to the stocks inside them. A Sankey diagram links each fund to its holdings.
Live version