d3.js
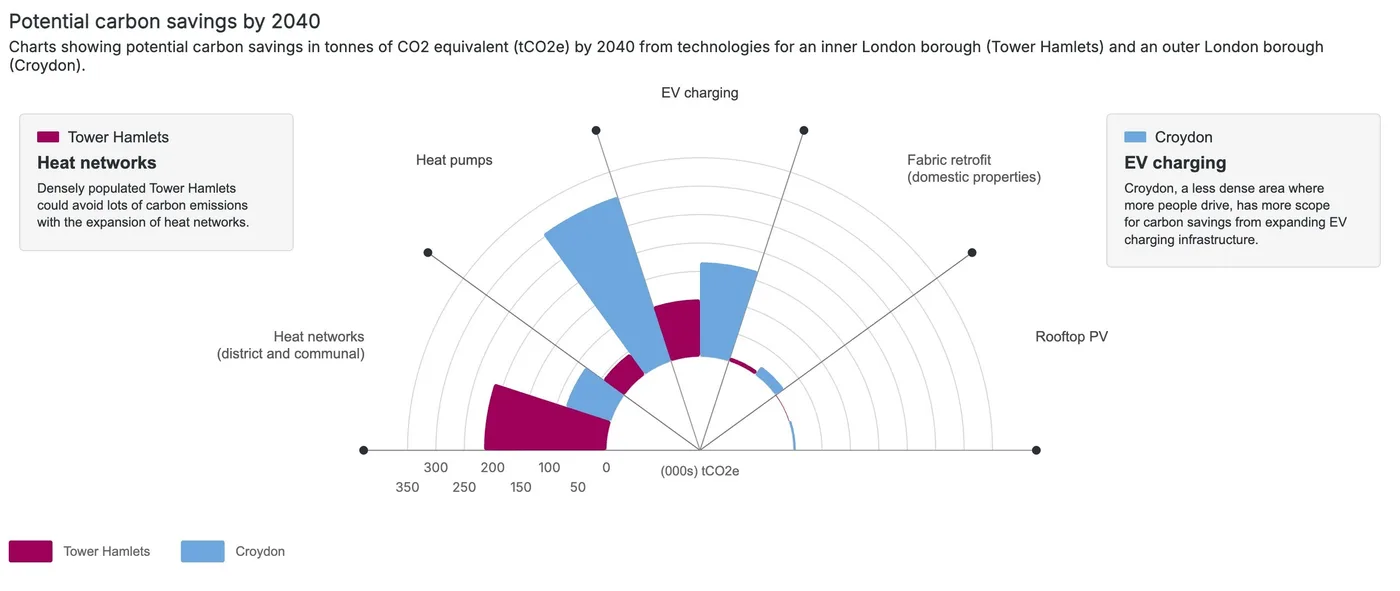
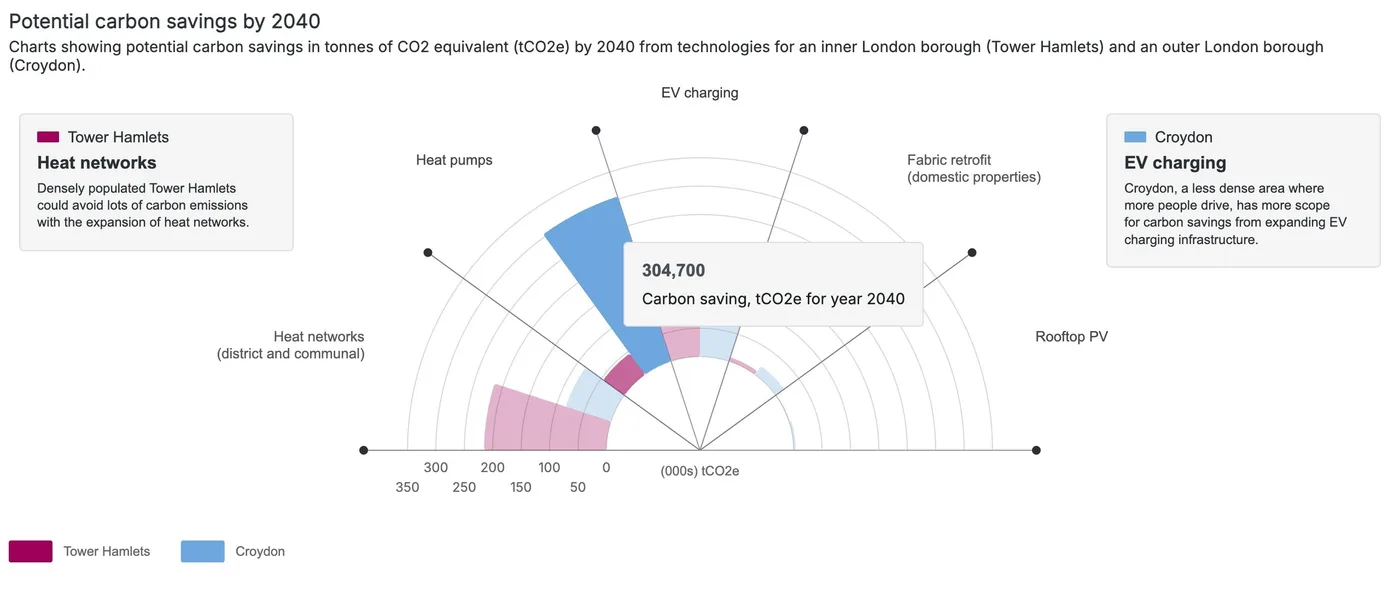
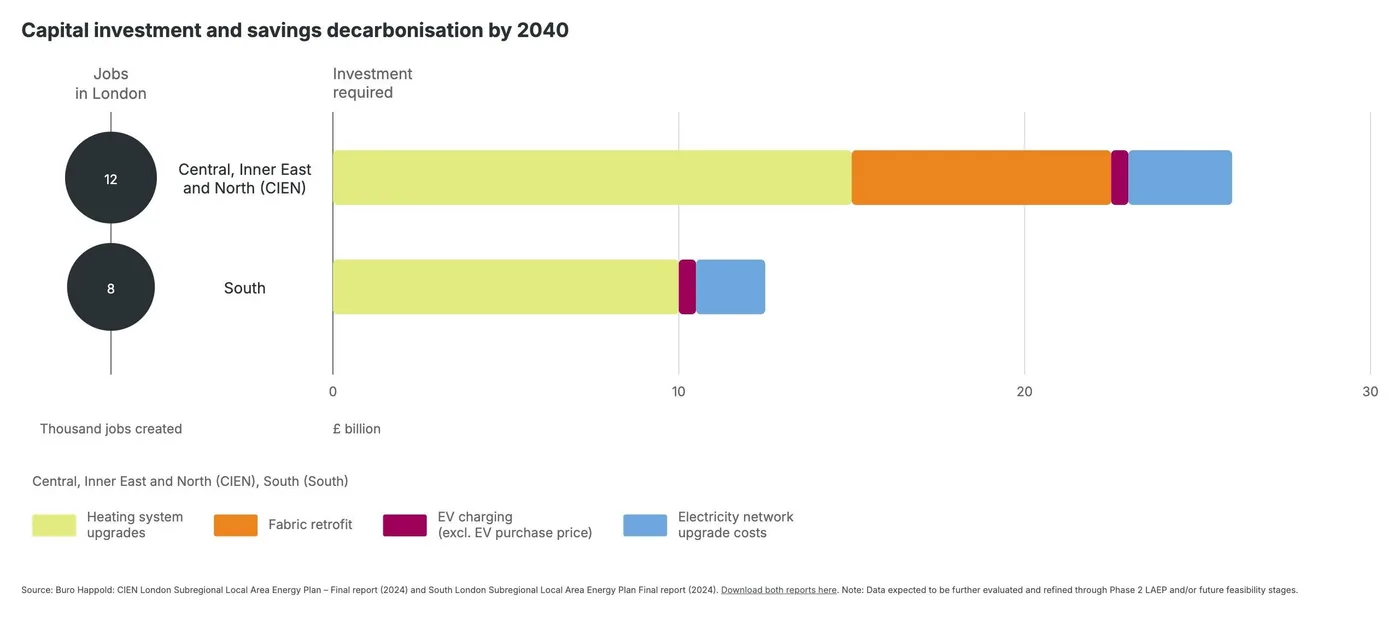
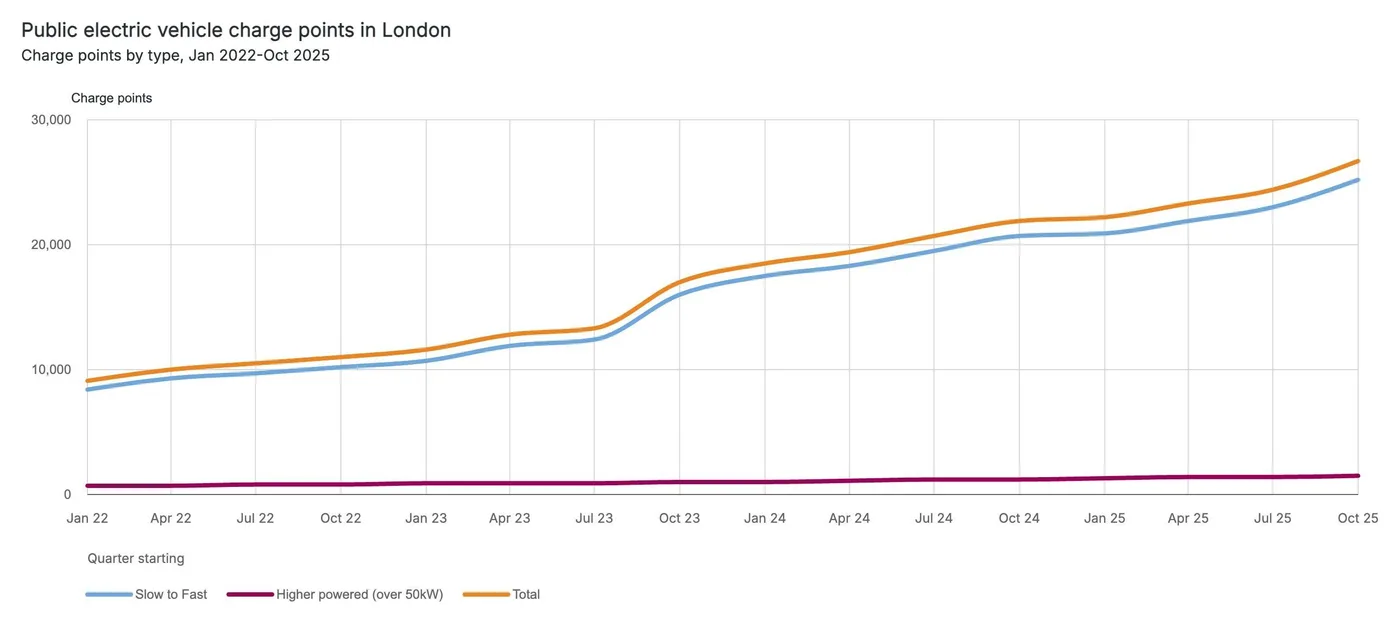
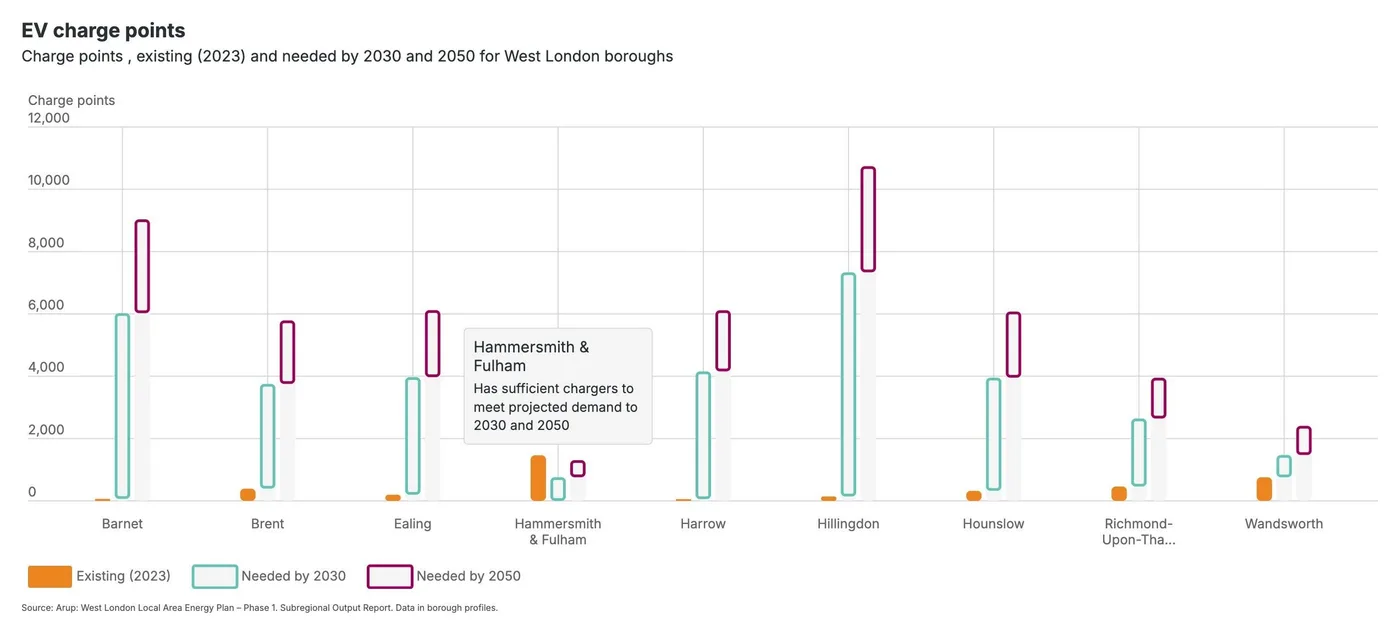
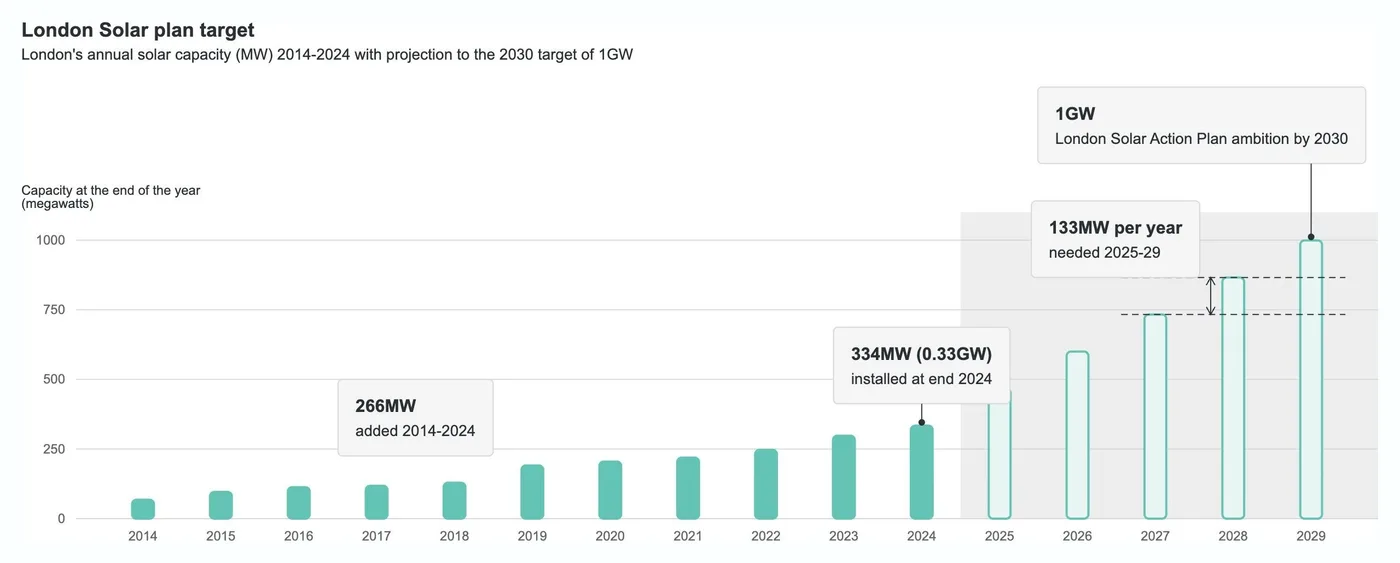
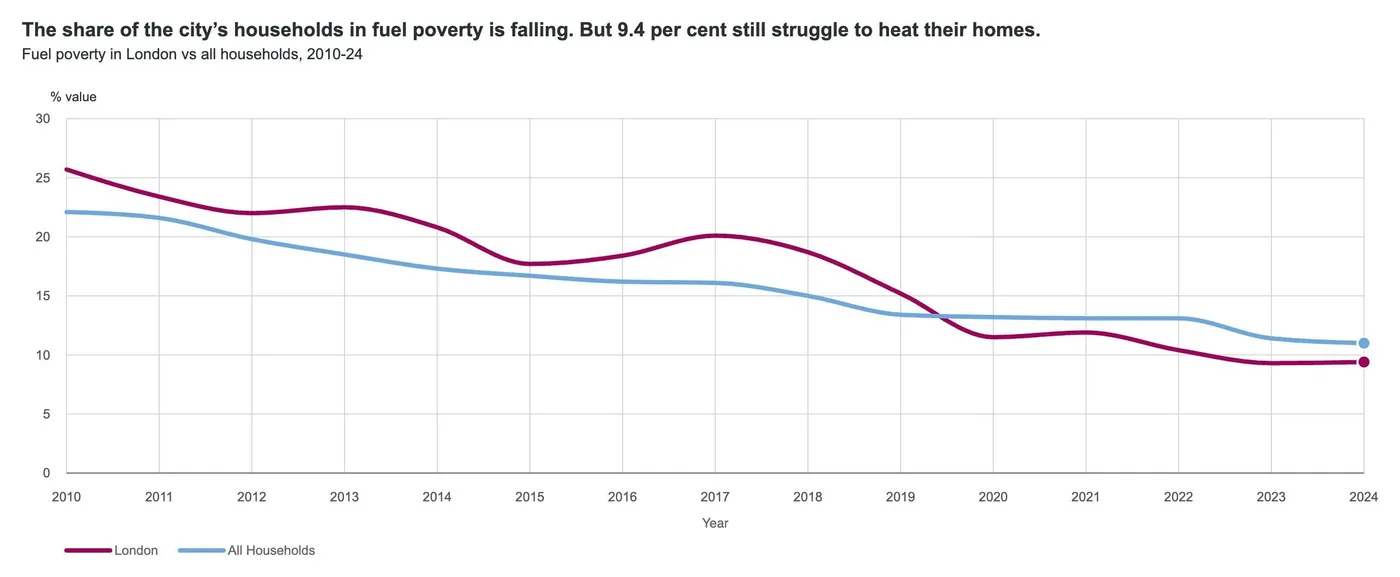
A set of charts for the Greater London Authority about London’s energy plans. Each chart is embedded on its own in a story.
In partnership with infogr8.