d3.js
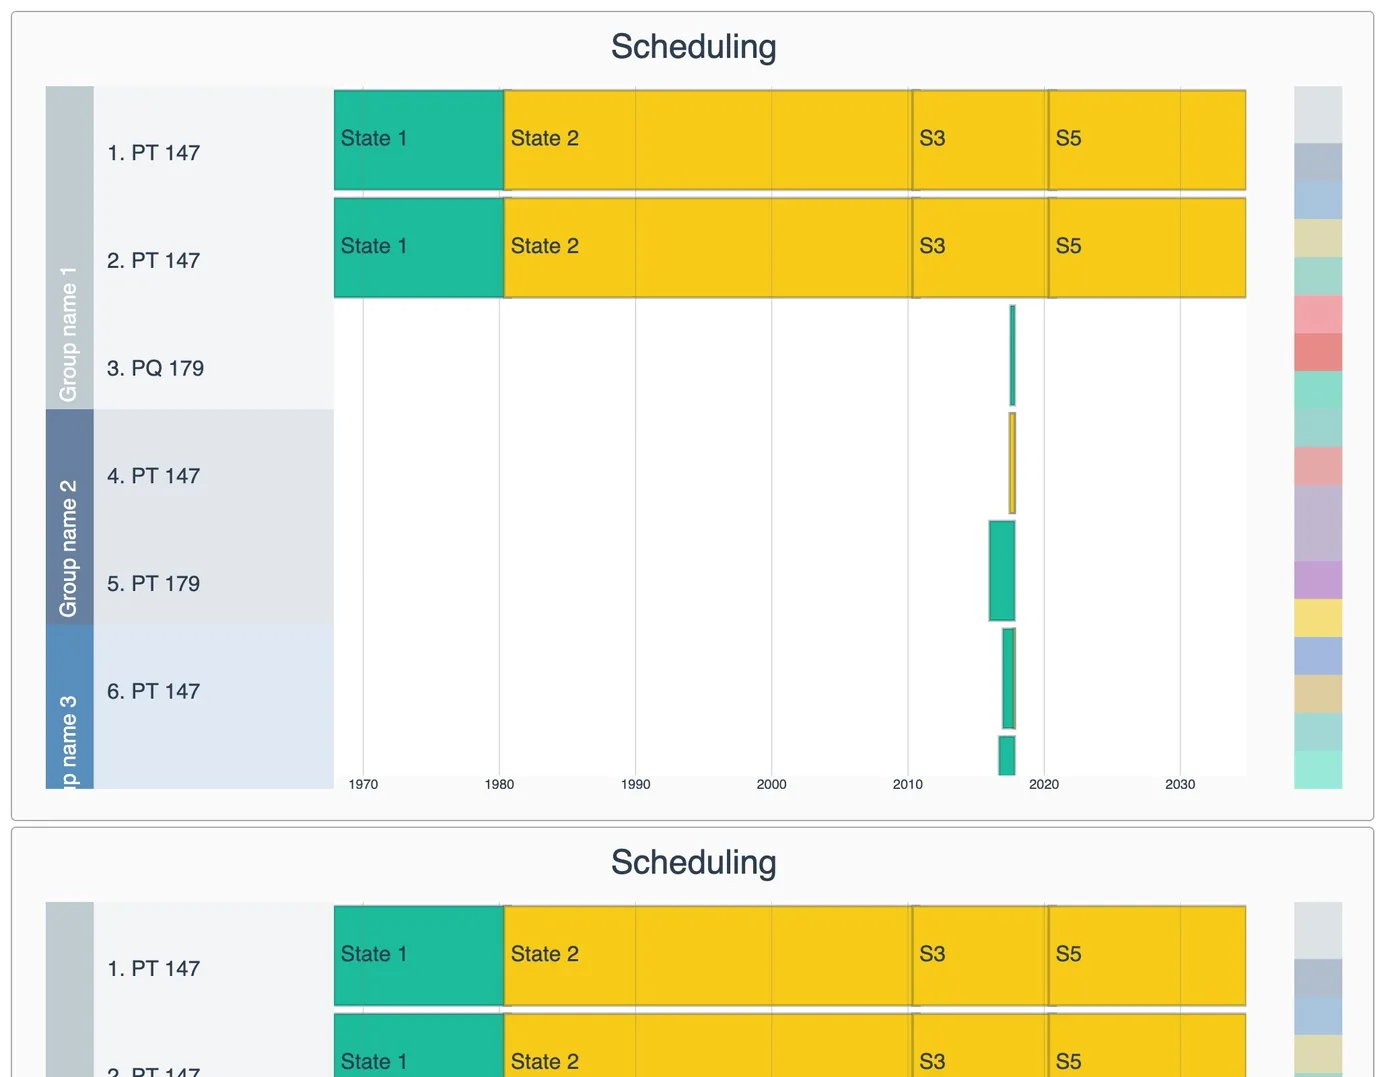
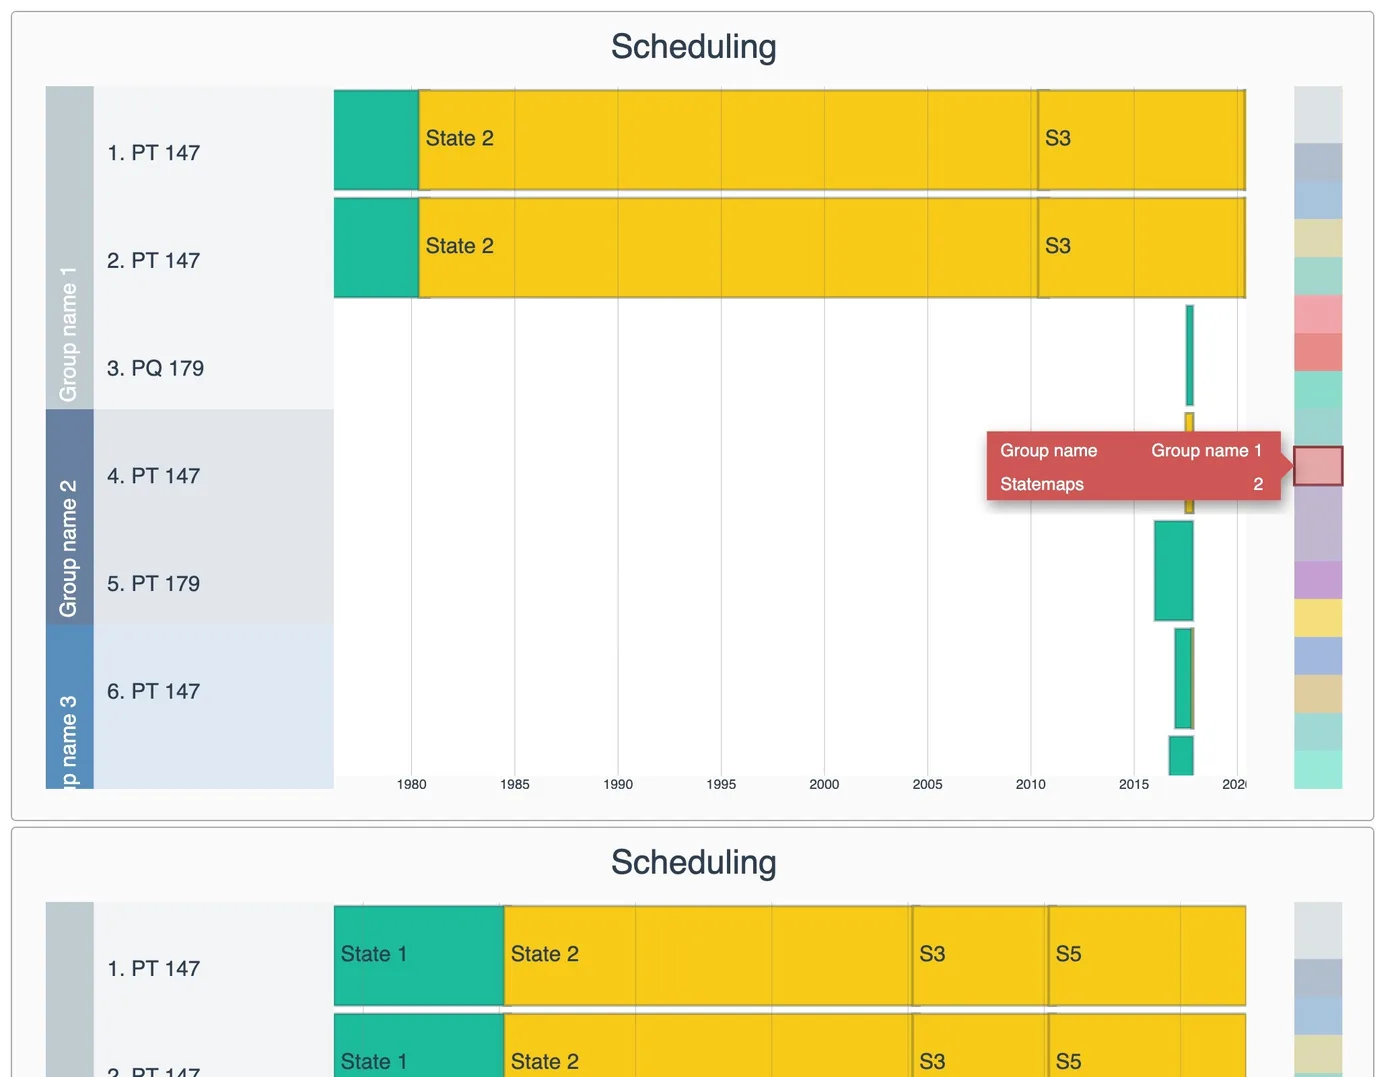
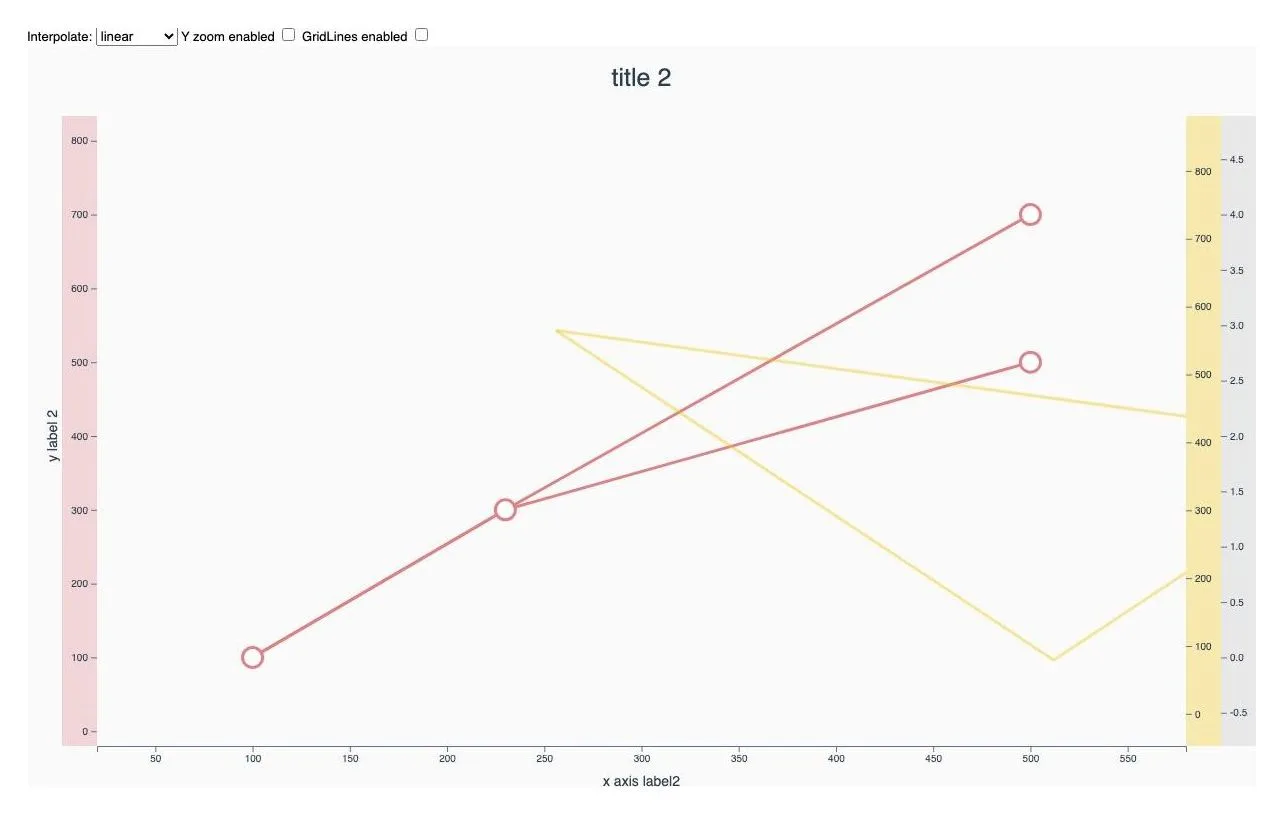
Two components. One is a line chart with zoom and the other is a scheduling timeline with grouped rows.