David B.
Creative developer with advanced data visualization focus
Projects
2D
3D
All
Notable Collaborations
Blog
About
Back
Oil and gas charts
d3.js
d3.js
chart
data visualization
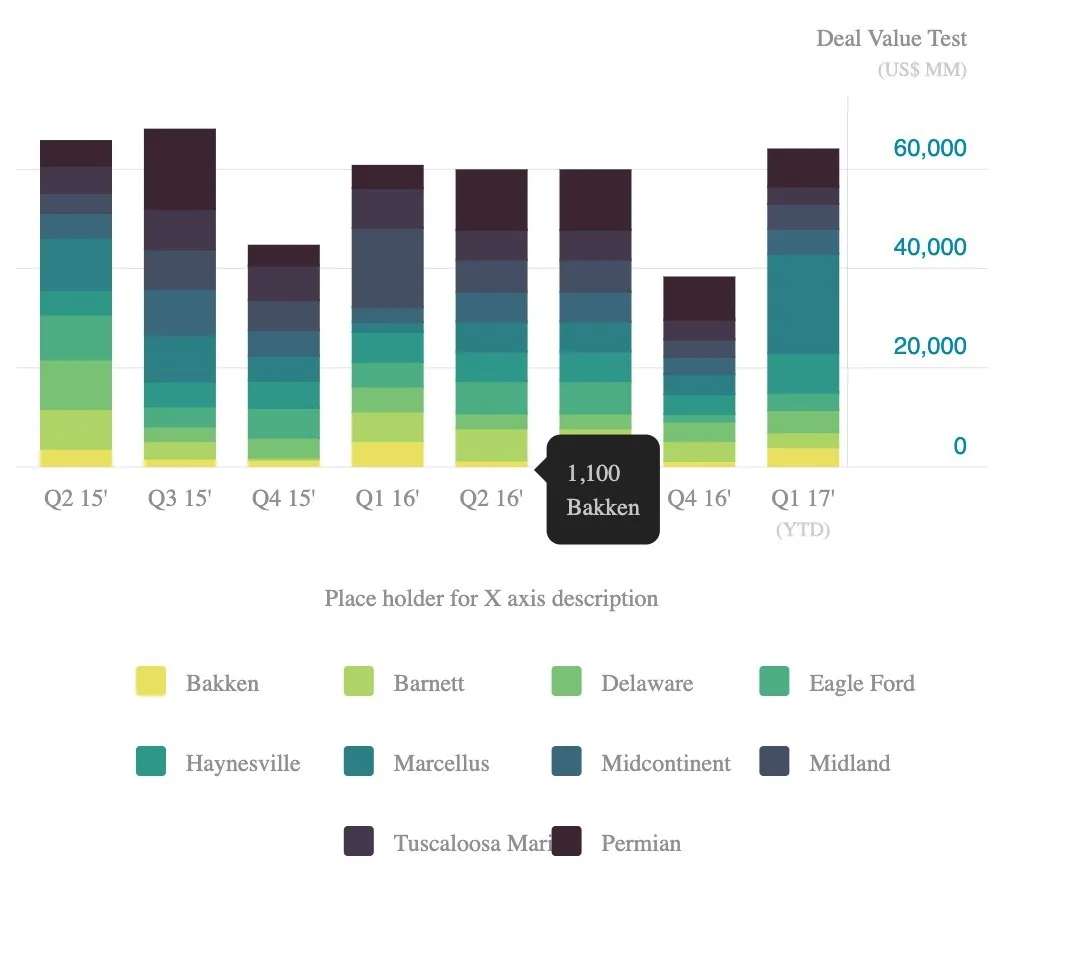
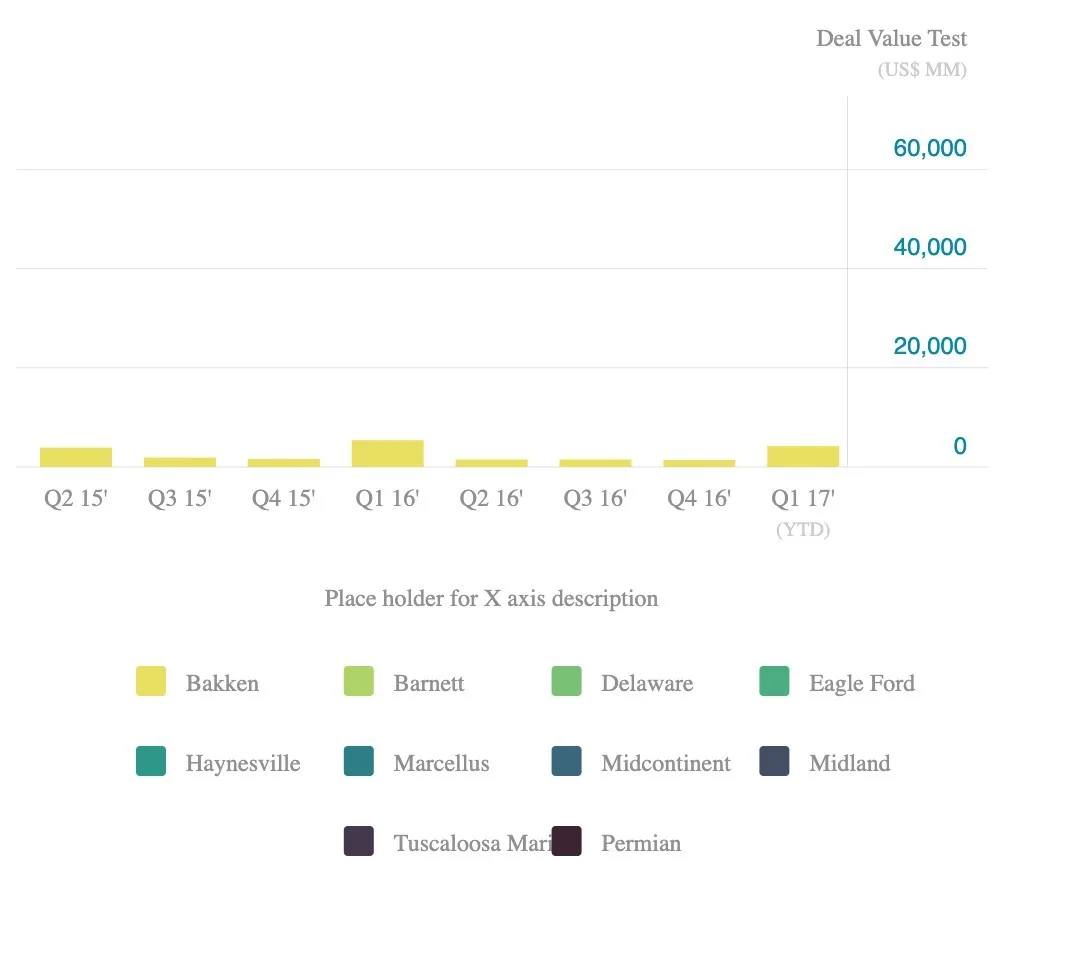
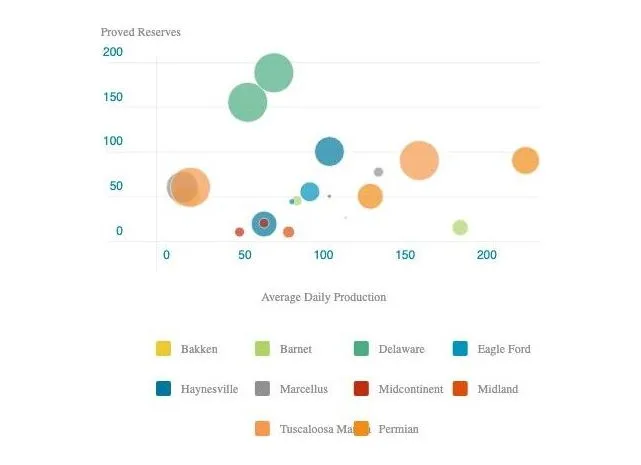
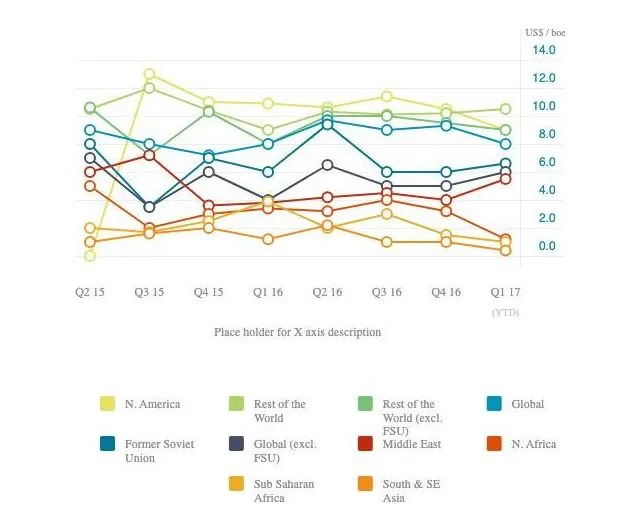
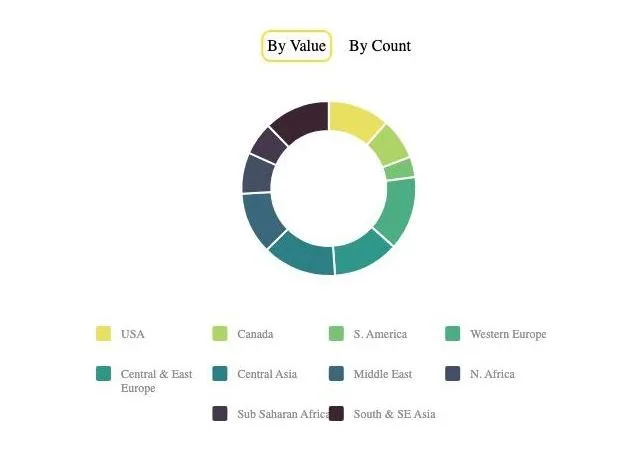
Four charts for oil and gas data. The stacked bars show deal value by quarter.