d3.js
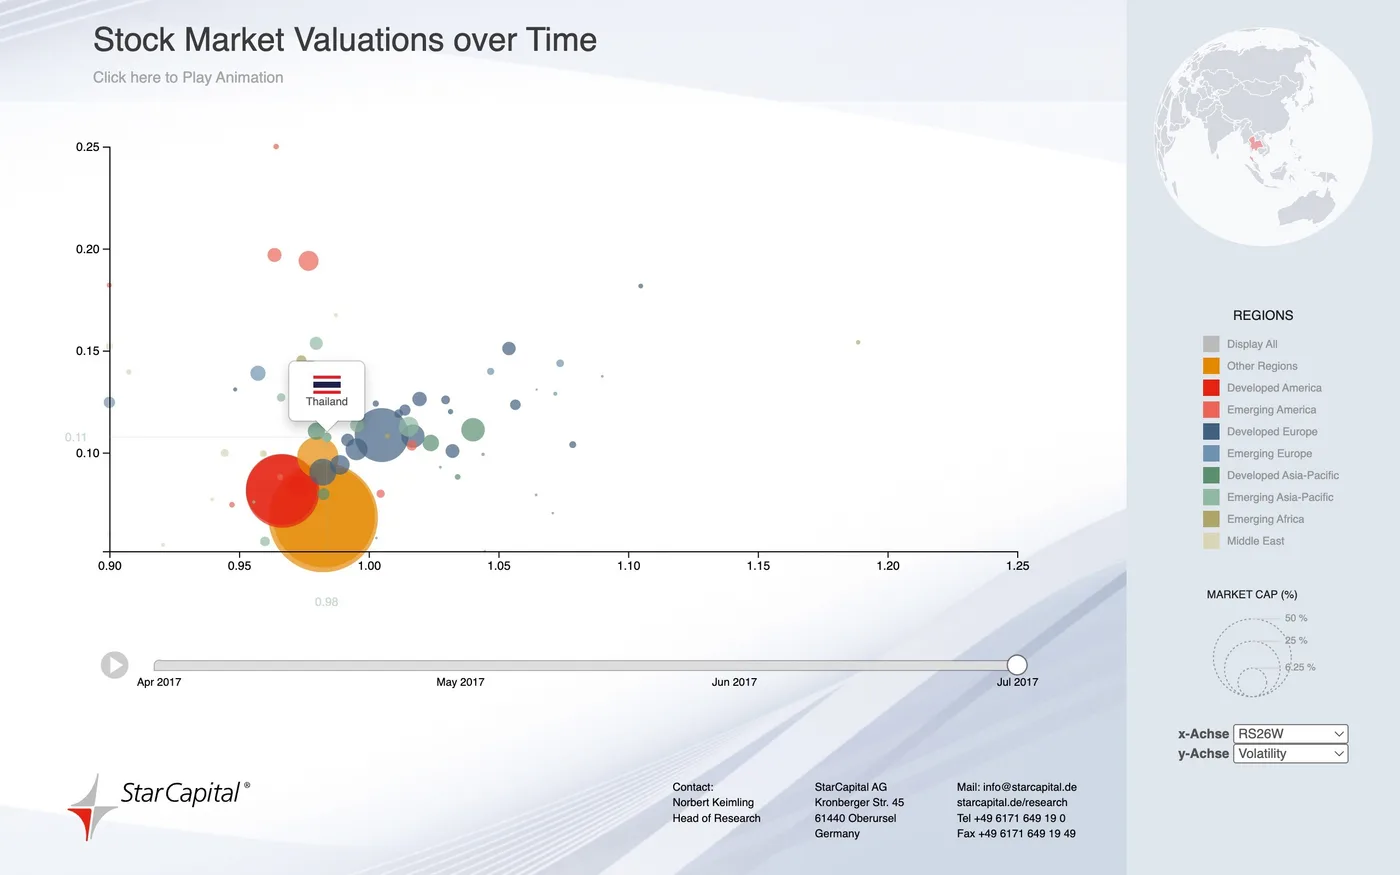
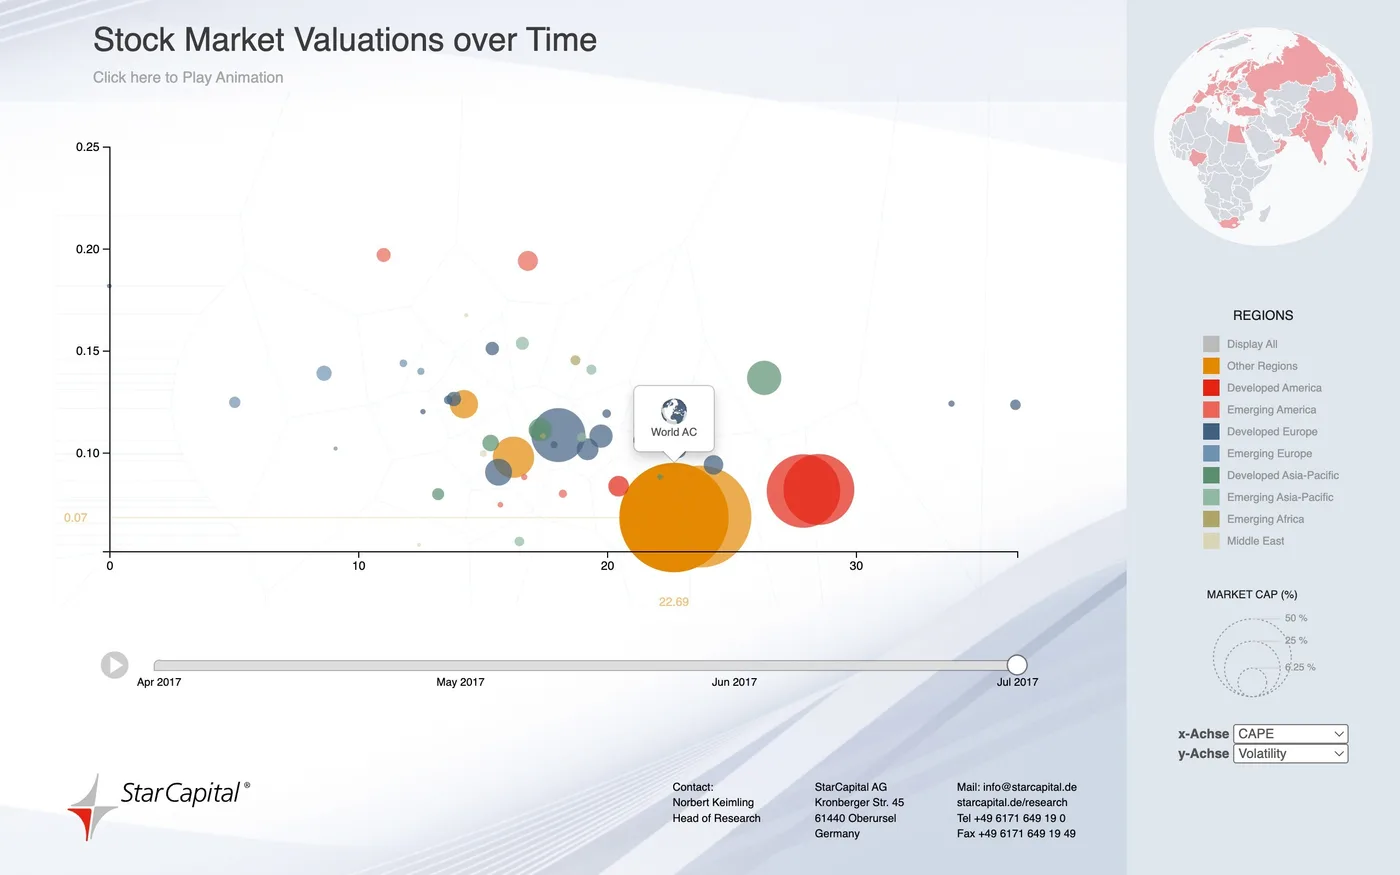
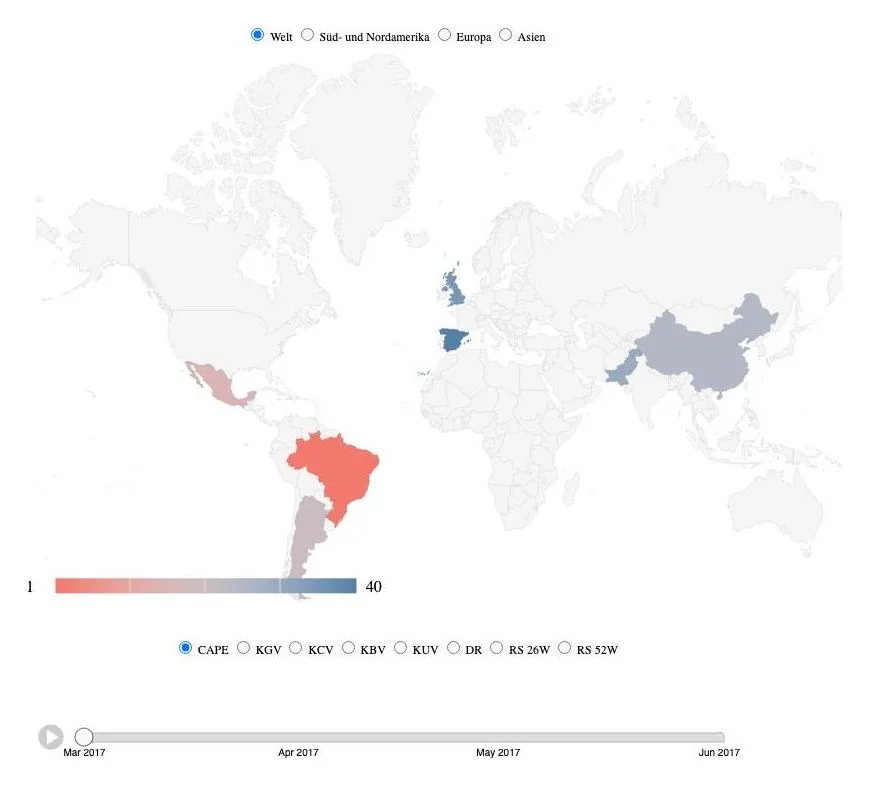
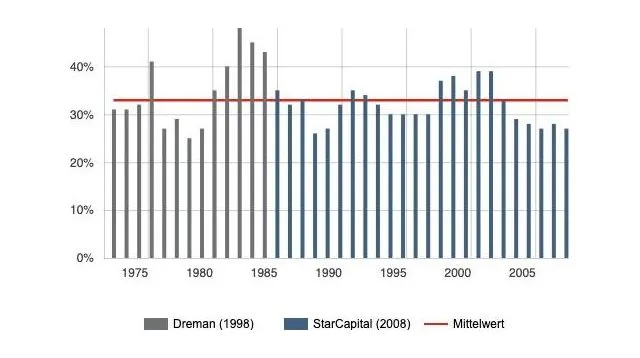
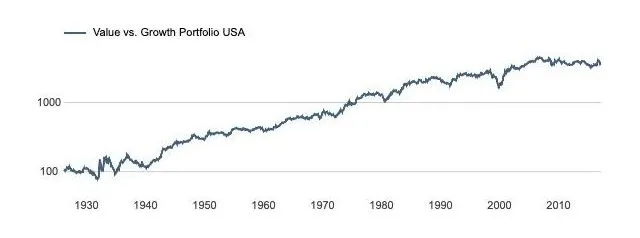
A set of charts on stock market valuations. The bubble chart plays through the months and the world map is shaded by a chosen ratio.