OS - Org Chart
d3.js
Org-Chart is my most successful open source project with more than hundred thousand of monthly npm downloads and more than 500 stars on Github.
It’s very flexible and quite performant component, and fascinating to see, what people are achieving with it.
Let’s touch some features:
Improved algorithm
Org chart will use d3-flextree, which offers much more customization opportunities, than the standard tree algorithm
Better Programmatic control
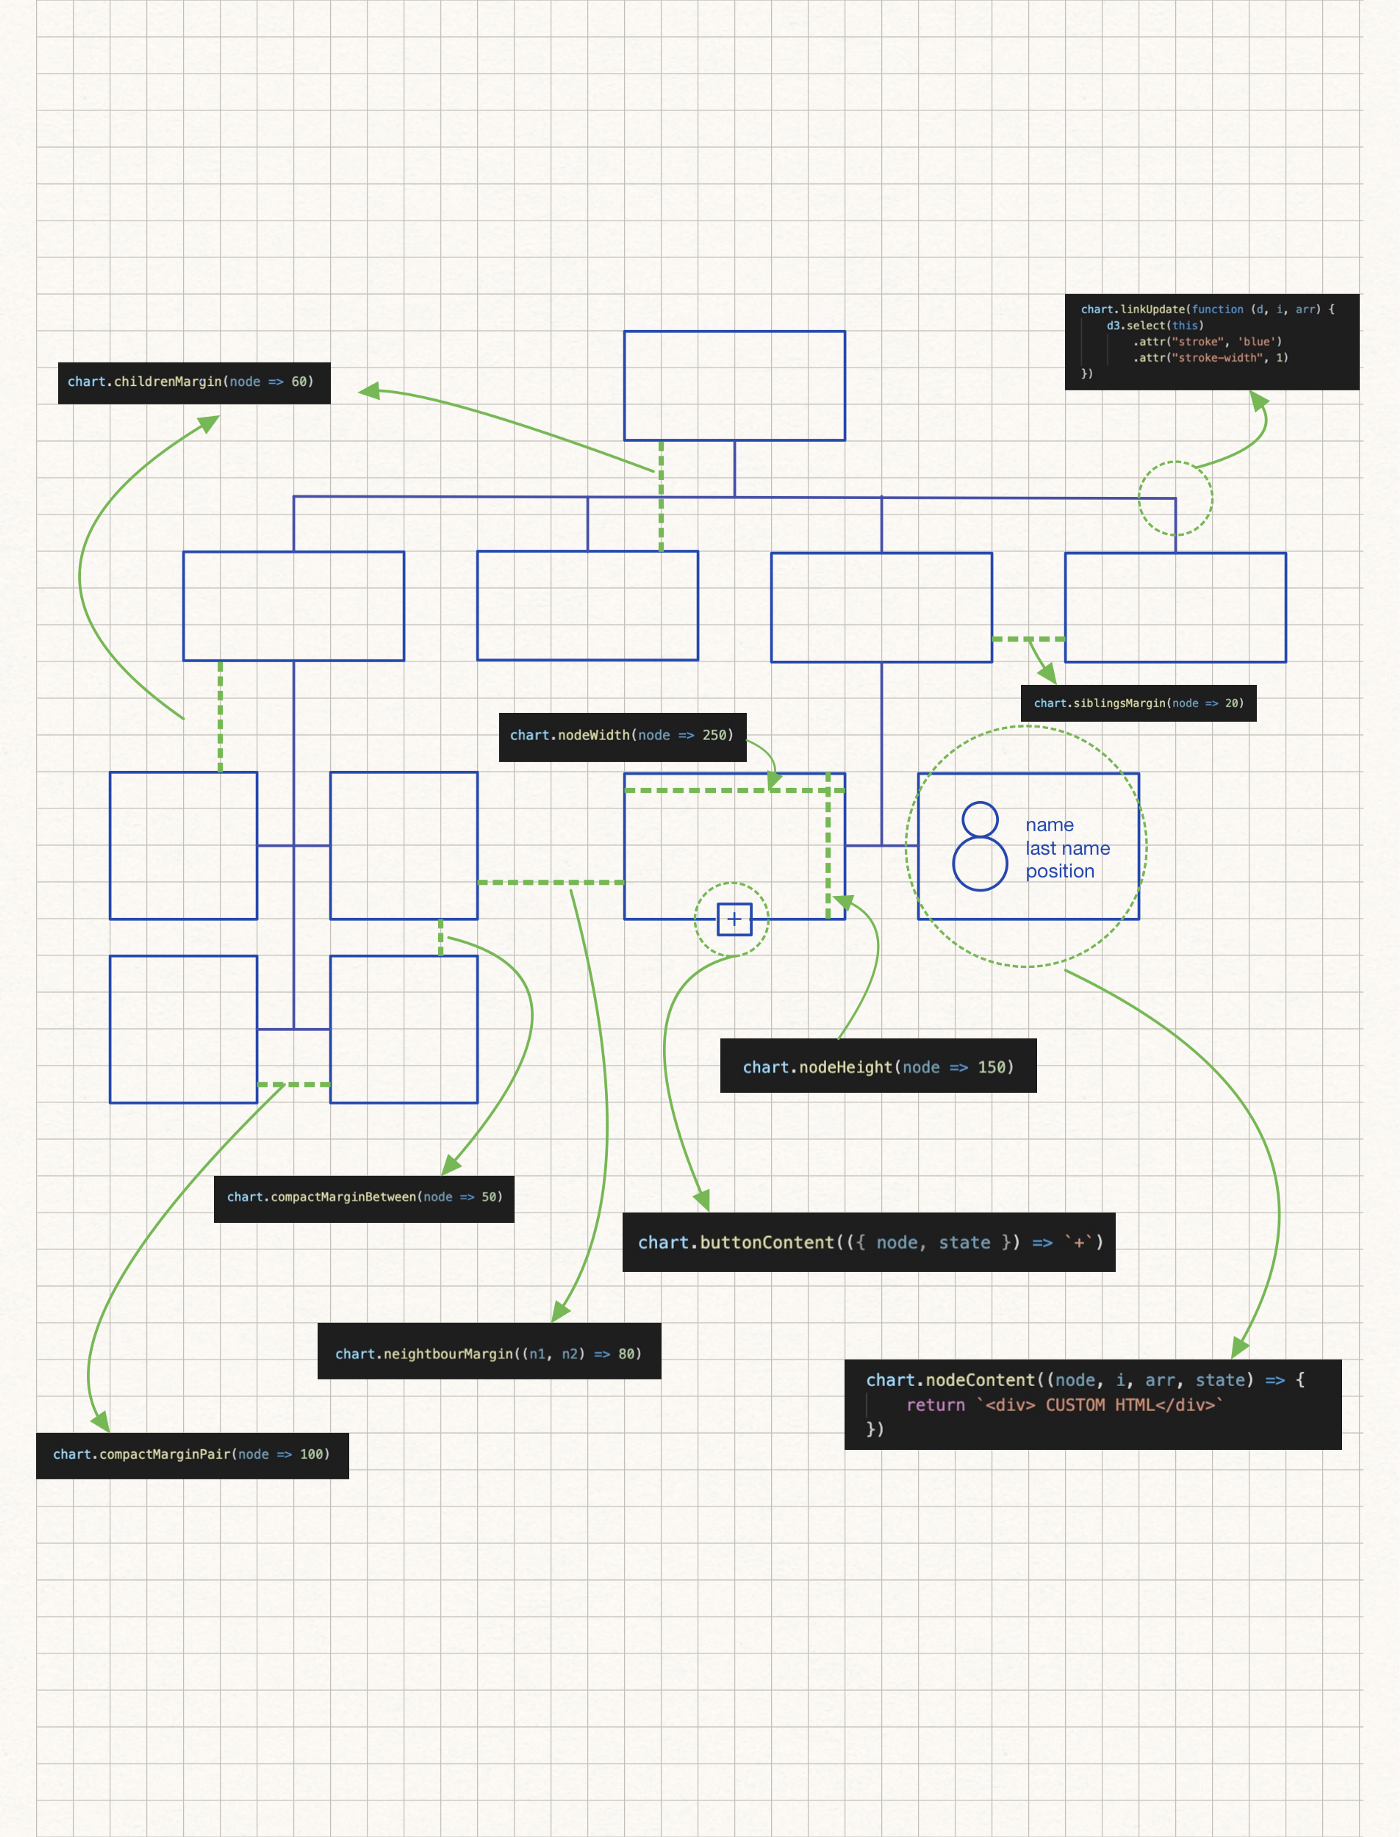
Now users can directly pass the function, which will generate each node content.
It will receive the d3 node as an argument, which means you not only directly have access to original data, but you also can take advantage of all d3 helper functions, like accessing parents, depth, width, and the height of node, getting descendants and accessors, looping over children via DFS or BFS e.t.c.
Apart from that, several helper props are added to the data (_expanded, ._centered,_totalSubordinates,_directSubordinates ), which will allow you to conditionally style the node
Here is a high-level overview of the common method signatures
Improved layout
Now users will be able to switch between compact or standard tree layouts and they will also be able to choose 4 different directions (left, top, bottom, right)

Improved UX features
Now you have the possibility to programmatically fit the chart to the screen, center, and highlight any node, and request a full-screen view. You also can zoom in and out programmatically (as well as manually).
In the new version, by default, the active node and branch will get centered, which is a huge win for mobile. It reduces the time for tree exploration drastically.
New features
From now on, you can specify additional connections between any two nodes

Exporting
In the new version, you have the ability to export images in PNG or SVG format. You can pass a callback function to receive the base64 string back, which can be used to generate PDF (Check how it is done here)
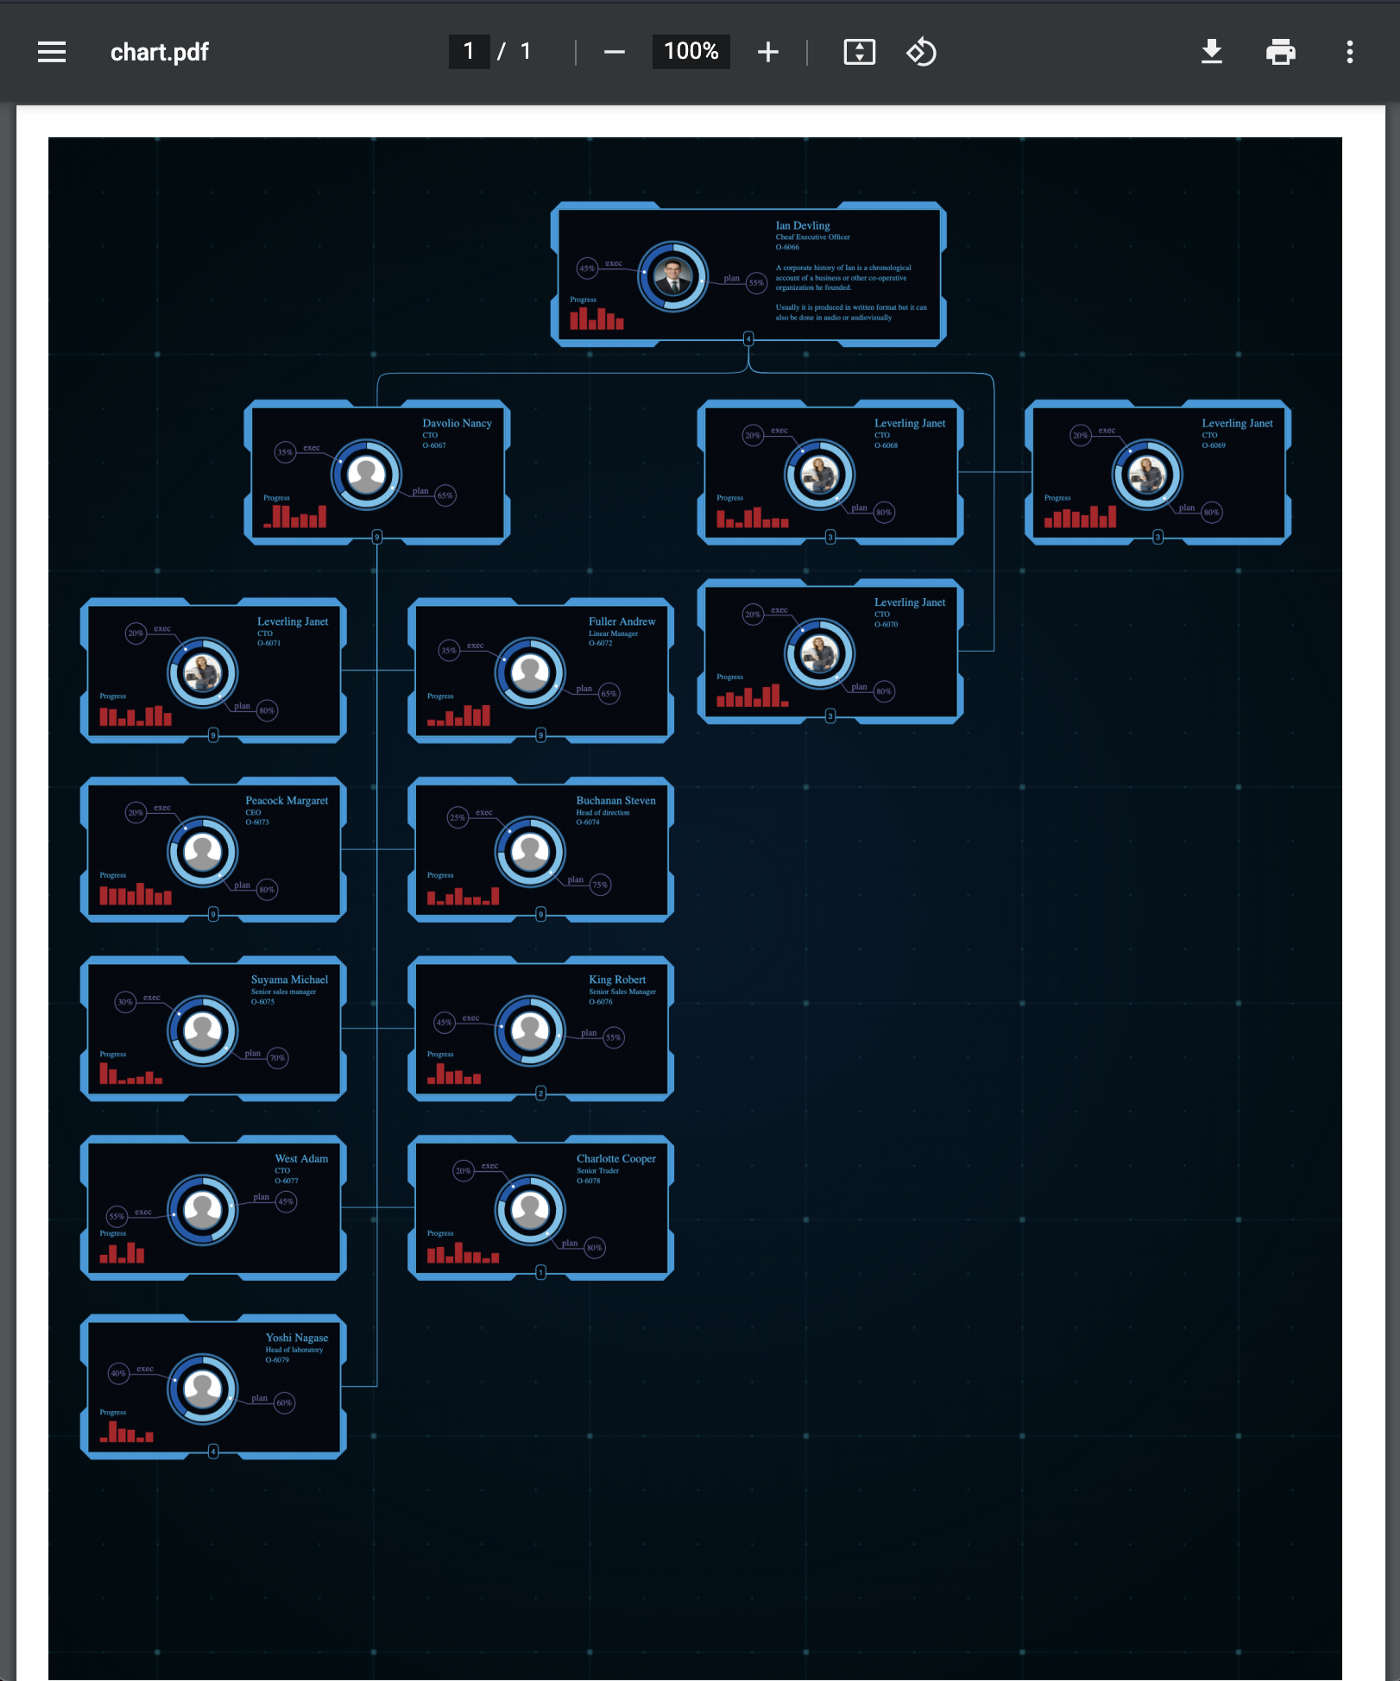
New examples
Several new examples were created for you to reuse. They are featuring different designs, layouts, and approaches of how to customize the default node view.
One of the examples shows how to achieve a similar view as in the previous version using the previous data format

Integrations
The updated version fixes some bugs from the previous version. All 3 major library/framework integrations are available. The new version imports only necessary parts from the d3 library, which should provide some optimizations as well.
If you need an org chart in your project, give it a try. I’d love to hear your honest feedback.
Thank you for reading.