Moxalise.ge
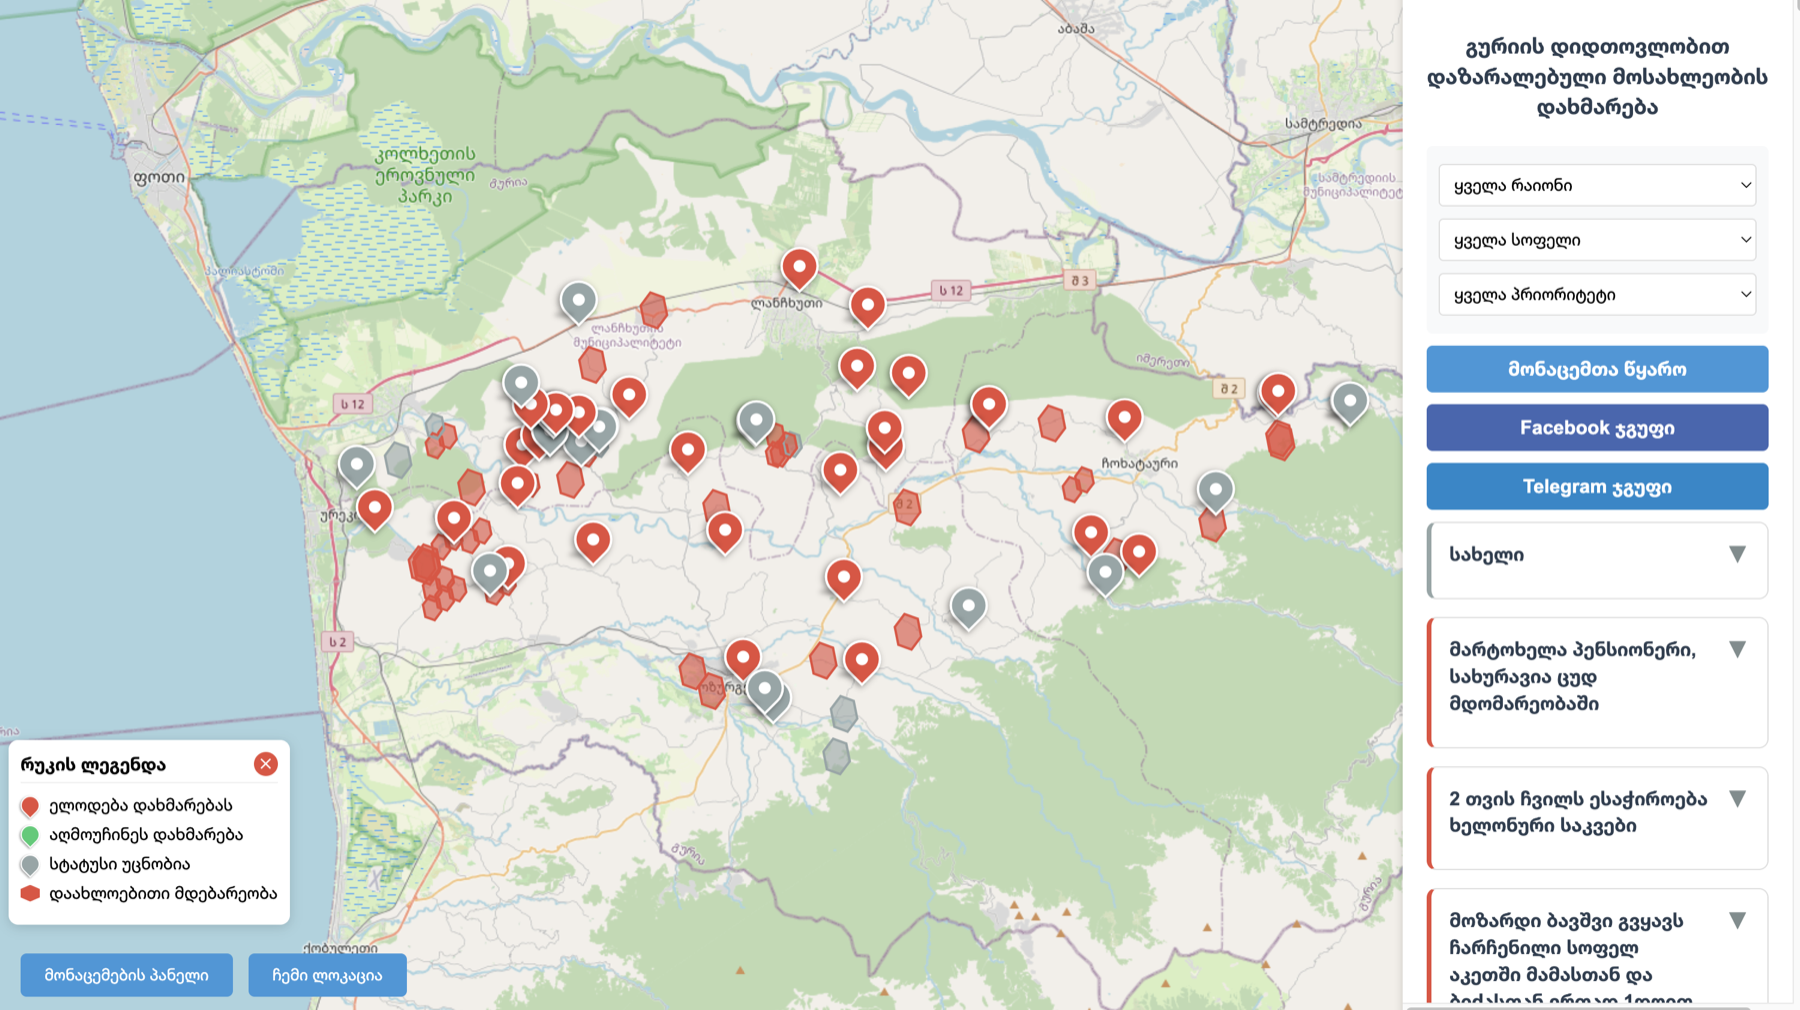
In February 2025 heavy snowfall cut off villages in Guria. Volunteers were coordinating over Telegram and Facebook, and tracking affected households in a Google Spreadsheet.
We built moxalise.ge on top of that spreadsheet — a map showing who needed help, where, and whether they’d been reached. Color coded pins for status, filters by district, village and priority, detail cards on each marker. Data came straight from the sheet, so coordinators kept working the way they already were.
Built with MapLibre GL JS, D3.js and Tippy.js, hosted on GitHub Pages.
On.ge wrote about it on launch day — article here.
The site is dormant now, ready to come back if it’s needed again. Code is open source and easy to repoint at another spreadsheet — github.com/bumbeishvili/moxalise.ge.